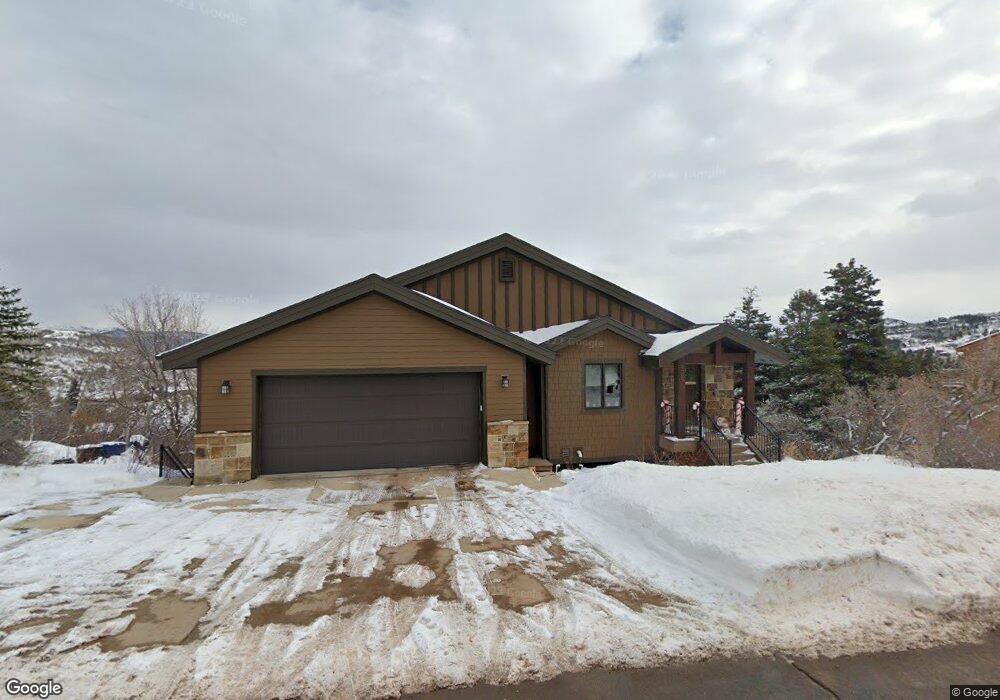
425 Crestview Dr Park City, UT 84098
Estimated Value: $1,200,000 - $1,622,000
Studio
1
Bath
1,381
Sq Ft
$976/Sq Ft
Est. Value
About This Home
This home is located at 425 Crestview Dr, Park City, UT 84098 and is currently estimated at $1,348,309, approximately $976 per square foot. 425 Crestview Dr is a home located in Summit County with nearby schools including Jeremy Ranch Elementary School, Ecker Hill Middle School, and Treasure Mountain Junior High School.
Ownership History
Date
Name
Owned For
Owner Type
Purchase Details
Closed on
Dec 4, 2020
Sold by
Quapp Kimberlee L
Bought by
Quapp Kevin J and The Quapp Asset Protection Tru
Current Estimated Value
Purchase Details
Closed on
Jul 17, 2013
Sold by
Quapp Kevin J
Bought by
Quapp Kevin J and Quapp Kimberly L
Home Financials for this Owner
Home Financials are based on the most recent Mortgage that was taken out on this home.
Original Mortgage
$496,000
Outstanding Balance
$344,505
Interest Rate
3.12%
Mortgage Type
Adjustable Rate Mortgage/ARM
Estimated Equity
$1,003,804
Purchase Details
Closed on
Jan 9, 2007
Sold by
Ellis Benjamin J and Ellis Krista M
Bought by
Quapp Kevin J
Home Financials for this Owner
Home Financials are based on the most recent Mortgage that was taken out on this home.
Original Mortgage
$162,000
Interest Rate
6.12%
Mortgage Type
New Conventional
Create a Home Valuation Report for This Property
The Home Valuation Report is an in-depth analysis detailing your home's value as well as a comparison with similar homes in the area
Home Values in the Area
Average Home Value in this Area
Purchase History
| Date | Buyer | Sale Price | Title Company |
|---|---|---|---|
| Quapp Kevin J | -- | None Available | |
| Quapp Kevin J | -- | Keystone Title Ins Agen | |
| Quapp Kevin J | -- | None Available |
Source: Public Records
Mortgage History
| Date | Status | Borrower | Loan Amount |
|---|---|---|---|
| Open | Quapp Kevin J | $496,000 | |
| Closed | Quapp Kevin J | $162,000 |
Source: Public Records
Tax History
| Year | Tax Paid | Tax Assessment Tax Assessment Total Assessment is a certain percentage of the fair market value that is determined by local assessors to be the total taxable value of land and additions on the property. | Land | Improvement |
|---|---|---|---|---|
| 2025 | $4,559 | $770,818 | $104,500 | $666,318 |
| 2024 | $4,467 | $816,701 | $110,000 | $706,701 |
| 2023 | $4,467 | $780,514 | $165,000 | $615,514 |
| 2022 | $4,201 | $648,874 | $101,750 | $547,124 |
| 2021 | $3,497 | $469,359 | $81,813 | $387,546 |
| 2020 | $3,660 | $464,106 | $53,763 | $410,343 |
| 2019 | $3,489 | $422,234 | $53,763 | $368,471 |
| 2018 | $3,261 | $394,599 | $53,763 | $340,836 |
| 2017 | $2,623 | $341,527 | $46,750 | $294,777 |
| 2016 | $2,822 | $341,527 | $46,750 | $294,777 |
| 2015 | $2,869 | $327,709 | $0 | $0 |
| 2013 | $325 | $35,000 | $0 | $0 |
Source: Public Records
Map
Nearby Homes
- 485 Crestview Dr
- 200 Aspen Dr
- 490 Upper Evergreen Dr
- 640 Aspen Dr
- 385 Upper Evergreen Dr Unit I-86
- 156 Lower Evergreen Dr Unit 8
- 390 Woodland Dr Unit B-28
- 390 Woodland Dr
- 185 Saint Moritz Strasse
- 4958 W Ponderosa Ct
- 165 Paradise Rd
- 165 Paradise Rd Unit 23
- 4915 Ponderosa Dr
- 620 Parkview Dr
- 415 Matterhorn Dr Unit 138
- 30 St Moritz Terrace
- 550 Matterhorn Dr Unit 91
- 475 Matterhorn Dr Unit 124
- 200 N Matterhorn Dr W
- 115 Saint Moritz Terrace
- 425 Crestview Dr Unit 4748
- 415 Crestview Dr
- 445 Crestview Dr
- 440 Crestview Dr
- 200 Crestview Dr
- 505 Crestview Dr
- 215 Crestview Dr
- 0 Crestview Dr
- 21 Crestview Dr
- 10 Crestview Dr
- 420 Crestview Dr
- 140 Crestview Ln
- 410 Crestview Dr
- 475 Crestview Dr
- 150 Crestview Ln
- 465 Crestview Dr
- 450 Crestview Dr Unit 44
- 395 Crestview Dr
- 400 Crestview Dr
- 125 Crestview Ln
Your Personal Tour Guide
Ask me questions while you tour the home.