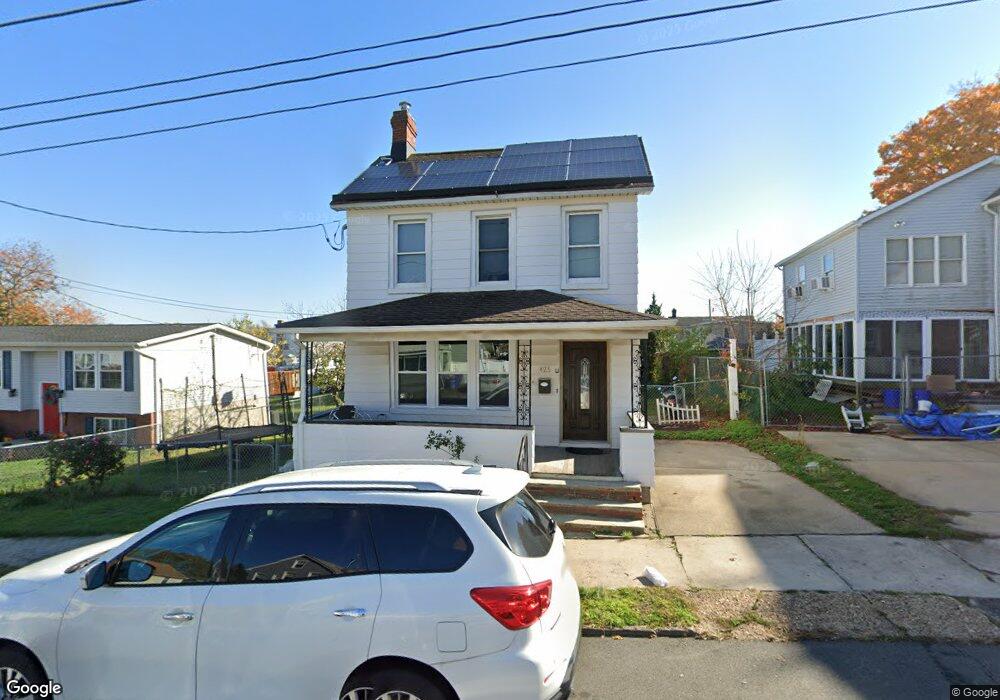
425 David St South Amboy, NJ 08879
Estimated Value: $406,368 - $566,000
--
Bed
--
Bath
1,396
Sq Ft
$341/Sq Ft
Est. Value
About This Home
This home is located at 425 David St, South Amboy, NJ 08879 and is currently estimated at $475,592, approximately $340 per square foot. 425 David St is a home located in Middlesex County with nearby schools including South Amboy Elementary School, South Amboy Middle/High School, and St. Mary Elementary School.
Ownership History
Date
Name
Owned For
Owner Type
Purchase Details
Closed on
Mar 2, 2001
Sold by
Estate Of Mary Midura
Bought by
Deworth Eric and Deworth Nicole
Current Estimated Value
Home Financials for this Owner
Home Financials are based on the most recent Mortgage that was taken out on this home.
Original Mortgage
$87,500
Outstanding Balance
$32,171
Interest Rate
7.15%
Estimated Equity
$443,421
Create a Home Valuation Report for This Property
The Home Valuation Report is an in-depth analysis detailing your home's value as well as a comparison with similar homes in the area
Home Values in the Area
Average Home Value in this Area
Purchase History
| Date | Buyer | Sale Price | Title Company |
|---|---|---|---|
| Deworth Eric | $110,000 | -- |
Source: Public Records
Mortgage History
| Date | Status | Borrower | Loan Amount |
|---|---|---|---|
| Open | Deworth Eric | $87,500 |
Source: Public Records
Tax History Compared to Growth
Tax History
| Year | Tax Paid | Tax Assessment Tax Assessment Total Assessment is a certain percentage of the fair market value that is determined by local assessors to be the total taxable value of land and additions on the property. | Land | Improvement |
|---|---|---|---|---|
| 2025 | $7,320 | $228,100 | $130,000 | $98,100 |
| 2024 | $7,044 | $228,100 | $130,000 | $98,100 |
| 2023 | $7,044 | $228,100 | $130,000 | $98,100 |
| 2022 | $6,692 | $228,100 | $130,000 | $98,100 |
| 2021 | $6,581 | $228,100 | $130,000 | $98,100 |
| 2020 | $6,426 | $228,100 | $130,000 | $98,100 |
| 2019 | $6,323 | $228,100 | $130,000 | $98,100 |
| 2018 | $6,196 | $225,400 | $130,000 | $95,400 |
| 2017 | $6,097 | $225,400 | $130,000 | $95,400 |
| 2016 | $5,944 | $225,400 | $130,000 | $95,400 |
| 2015 | $5,987 | $225,400 | $130,000 | $95,400 |
| 2014 | $5,782 | $225,400 | $130,000 | $95,400 |
Source: Public Records
Map
Nearby Homes
- 504 Col Db Kelly Way
- 504 Colonel D B Kelly Way
- 411 Lefferts St
- 322 George St
- 518 Center St
- 101 N Stevens Ave
- 528 Catherine St
- 442 Bordentown Ave
- 123 S Stevens Ave
- 326 Walnut St
- 433 Gordon St
- 231 N Stevens Ave
- 251 Church St
- 15 Bertram Ave
- 245 2nd St
- 320 Parker Ave
- 237 George St
- 223 Henry St
- 112 N Broadway Unit C
- 112 N Broadway Unit G