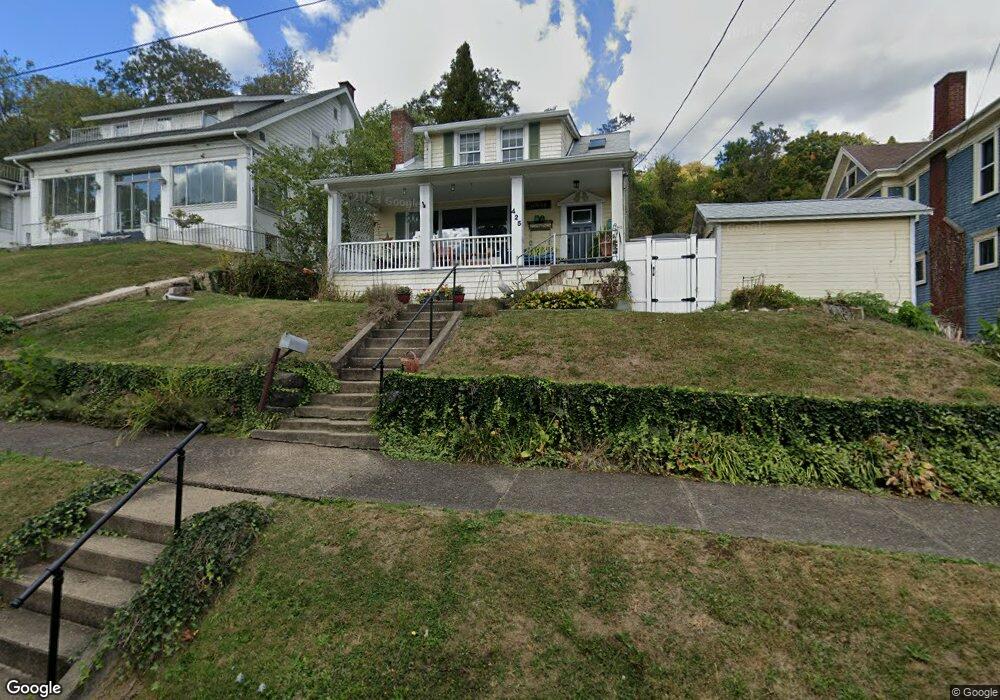
425 Elm St Martins Ferry, OH 43935
Estimated Value: $102,000 - $147,000
3
Beds
2
Baths
1,440
Sq Ft
$88/Sq Ft
Est. Value
About This Home
This home is located at 425 Elm St, Martins Ferry, OH 43935 and is currently estimated at $126,836, approximately $88 per square foot. 425 Elm St is a home located in Belmont County with nearby schools including Anna Marie Ayers Elementary School, Martins Ferry Middle School, and Martins Ferry High School.
Ownership History
Date
Name
Owned For
Owner Type
Purchase Details
Closed on
Nov 9, 2007
Sold by
Mccracken Jerry C and Mccracken Regina
Bought by
Forsyth Catherine M
Current Estimated Value
Home Financials for this Owner
Home Financials are based on the most recent Mortgage that was taken out on this home.
Original Mortgage
$86,700
Outstanding Balance
$55,026
Interest Rate
6.44%
Mortgage Type
Purchase Money Mortgage
Estimated Equity
$71,811
Purchase Details
Closed on
Oct 26, 2004
Sold by
Mccracken Jerry C and Mccracken Re
Bought by
Mccracken Jerry C and Mccracken Re
Purchase Details
Closed on
Jul 25, 1996
Sold by
Lenz Patrick J and Lenz Nikki J
Bought by
Lenz Patrick J and Lenz Nikki J
Purchase Details
Closed on
Jan 1, 1986
Sold by
Durr Naomi L
Bought by
Durr Naomi L
Create a Home Valuation Report for This Property
The Home Valuation Report is an in-depth analysis detailing your home's value as well as a comparison with similar homes in the area
Home Values in the Area
Average Home Value in this Area
Purchase History
| Date | Buyer | Sale Price | Title Company |
|---|---|---|---|
| Forsyth Catherine M | $85,000 | Eagle Title Agency | |
| Mccracken Jerry C | $82,000 | -- | |
| Lenz Patrick J | $25,000 | -- | |
| Durr Naomi L | -- | -- |
Source: Public Records
Mortgage History
| Date | Status | Borrower | Loan Amount |
|---|---|---|---|
| Open | Forsyth Catherine M | $86,700 |
Source: Public Records
Tax History Compared to Growth
Tax History
| Year | Tax Paid | Tax Assessment Tax Assessment Total Assessment is a certain percentage of the fair market value that is determined by local assessors to be the total taxable value of land and additions on the property. | Land | Improvement |
|---|---|---|---|---|
| 2024 | $1,457 | $35,490 | $3,970 | $31,520 |
| 2023 | $1,192 | $26,630 | $3,800 | $22,830 |
| 2022 | $1,192 | $26,634 | $3,804 | $22,830 |
| 2021 | $1,187 | $26,652 | $3,804 | $22,848 |
| 2020 | $1,113 | $23,180 | $3,310 | $19,870 |
| 2019 | $1,115 | $23,180 | $3,310 | $19,870 |
| 2018 | $1,061 | $23,180 | $3,310 | $19,870 |
| 2017 | $1,259 | $26,570 | $4,270 | $22,300 |
| 2016 | $1,263 | $26,570 | $4,270 | $22,300 |
| 2015 | $1,138 | $26,570 | $4,270 | $22,300 |
| 2014 | $1,086 | $25,130 | $3,890 | $21,240 |
| 2013 | $1,032 | $25,130 | $3,890 | $21,240 |
Source: Public Records
Map
Nearby Homes