Estimated Value: $239,000 - $271,044
3
Beds
1
Bath
1,375
Sq Ft
$187/Sq Ft
Est. Value
About This Home
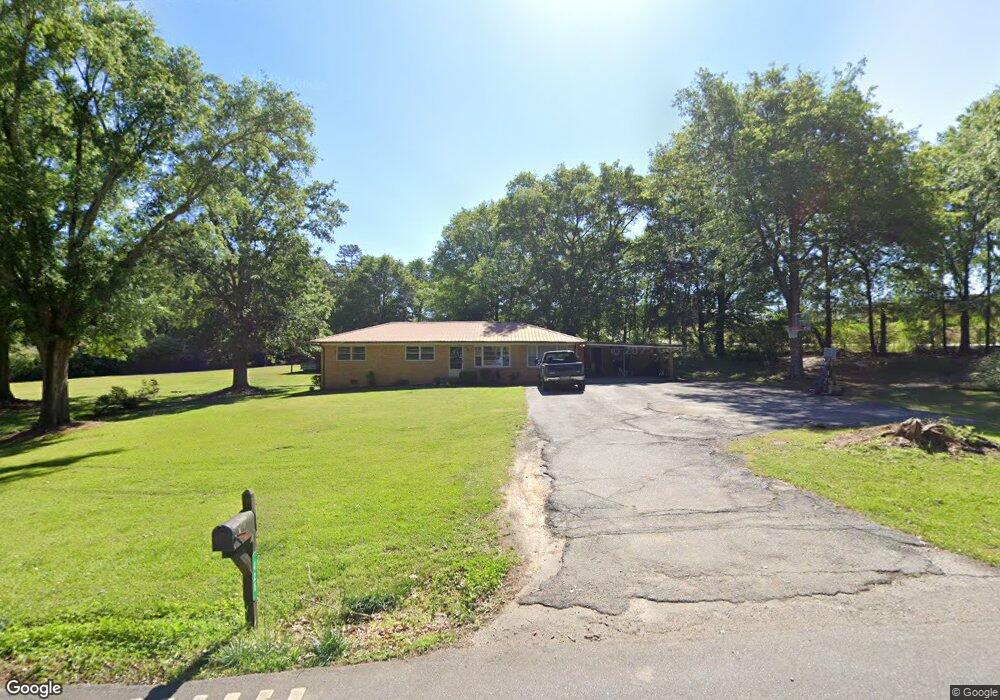
This home is located at 425 Hill St, Homer, GA 30547 and is currently estimated at $256,511, approximately $186 per square foot. 425 Hill St is a home located in Banks County with nearby schools including Banks County Primary School, Banks County Elementary School, and Banks County Middle School.
Ownership History
Date
Name
Owned For
Owner Type
Purchase Details
Closed on
May 19, 2023
Sold by
Satterfield Loren K
Bought by
Satterfield Loren K and Satterfield Steven
Current Estimated Value
Home Financials for this Owner
Home Financials are based on the most recent Mortgage that was taken out on this home.
Original Mortgage
$225,834
Outstanding Balance
$219,312
Interest Rate
6.39%
Mortgage Type
FHA
Estimated Equity
$37,199
Purchase Details
Closed on
Sep 1, 2020
Sold by
Hulsey Cinda W
Bought by
Rylee Real Estate Holdings Llc
Home Financials for this Owner
Home Financials are based on the most recent Mortgage that was taken out on this home.
Original Mortgage
$128,000
Interest Rate
2.8%
Mortgage Type
New Conventional
Purchase Details
Closed on
Jun 9, 2011
Sold by
Westbrooks Jessie C
Bought by
Richards Brenda W and Hulsey Cinda W
Create a Home Valuation Report for This Property
The Home Valuation Report is an in-depth analysis detailing your home's value as well as a comparison with similar homes in the area
Home Values in the Area
Average Home Value in this Area
Purchase History
| Date | Buyer | Sale Price | Title Company |
|---|---|---|---|
| Satterfield Loren K | -- | -- | |
| Satterfield Loren K | $230,000 | -- | |
| Rylee Real Estate Holdings Llc | $130,000 | -- | |
| Richards Brenda W | -- | -- | |
| Westbrooks Jessie C | -- | -- |
Source: Public Records
Mortgage History
| Date | Status | Borrower | Loan Amount |
|---|---|---|---|
| Open | Satterfield Loren K | $225,834 | |
| Previous Owner | Rylee Real Estate Holdings Llc | $128,000 |
Source: Public Records
Tax History Compared to Growth
Tax History
| Year | Tax Paid | Tax Assessment Tax Assessment Total Assessment is a certain percentage of the fair market value that is determined by local assessors to be the total taxable value of land and additions on the property. | Land | Improvement |
|---|---|---|---|---|
| 2025 | $1,645 | $86,153 | $25,295 | $60,858 |
| 2024 | $1,645 | $80,754 | $22,996 | $57,758 |
| 2023 | $1,591 | $66,975 | $24,535 | $42,440 |
| 2022 | $1,149 | $54,687 | $18,442 | $36,245 |
| 2021 | $1,013 | $45,325 | $14,186 | $31,139 |
| 2020 | $912 | $39,765 | $10,575 | $29,190 |
| 2019 | $916 | $39,765 | $10,575 | $29,190 |
| 2018 | $845 | $36,049 | $10,413 | $25,636 |
| 2017 | $852 | $34,850 | $9,055 | $25,795 |
| 2016 | $840 | $33,423 | $9,055 | $24,368 |
| 2015 | $902 | $33,423 | $9,055 | $24,368 |
| 2014 | $902 | $38,228 | $13,860 | $24,368 |
| 2013 | -- | $38,228 | $13,860 | $24,368 |
Source: Public Records
Map
Nearby Homes
- 483 Greasy Creek St
- 0 Georgia 98
- 0 Highway 98 Unit 10609064
- 376 Athens St
- 817 Yonah Homer Rd
- 122 Cannon Creek
- 114 Classic Overlook
- 1570 Historic Homer Hwy
- 118 Classic Overlook
- 128 Classic Overlook
- 130 Classic Overlook
- 1330 Yonah Homer Rd
- TRACT 2 McCoy Bridge Rd
- 167 McCoy Bridge Rd
- 144 Classic Overlook
- 146 Preserve Ln
- 151 Sweet Briar Way
- Bedford Plan at Chimney Oaks - Cottages
- Woodbury Plan at Chimney Oaks - Cottages
- Bedford Plan at Chimney Oaks - Preserve
- 0 Hill St Unit 7351800
- 313 Hill St
- 368 Hill St
- 312 Hill St
- 347 Greasy Creek St
- 100 Highway 51 S
- 287 Hill St
- 489 Highway 51 S
- 359 Greasy Creek St
- 346 Highway 51 S
- 205 Highway 51 S
- 102 Oak St
- 161 Highway 51 S
- 194 Hill St
- 1076 Historic Homer Hwy
- 244 Garrison St
- 124 Brown St
- 270 Garrison St
- 121 Brown St
- 164 Hill St