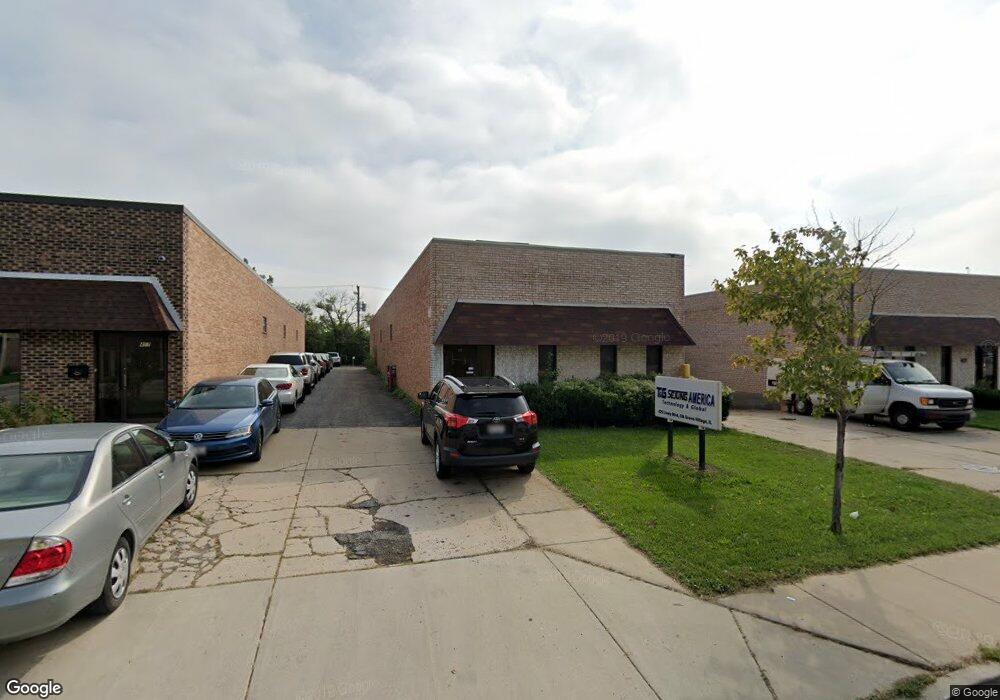
425 Lively Blvd Elk Grove Village, IL 60007
Elk Grove Village East NeighborhoodEstimated Value: $976,442
--
Bed
--
Bath
--
Sq Ft
0.5
Acres
About This Home
This home is located at 425 Lively Blvd, Elk Grove Village, IL 60007 and is currently estimated at $976,442. 425 Lively Blvd is a home located in Cook County with nearby schools including Rupley Elementary School, Grove Jr High School, and Elk Grove High School.
Ownership History
Date
Name
Owned For
Owner Type
Purchase Details
Closed on
Jun 3, 2022
Sold by
Eclipse One Llc
Bought by
Big Squeeze Llc
Current Estimated Value
Purchase Details
Closed on
Apr 30, 2019
Sold by
Tgs Solution Inc
Bought by
The Eclipse One Llc
Home Financials for this Owner
Home Financials are based on the most recent Mortgage that was taken out on this home.
Original Mortgage
$304,000
Interest Rate
5%
Mortgage Type
Commercial
Purchase Details
Closed on
Mar 22, 2016
Sold by
Sejung T and Sejung G
Bought by
Tgs Solution Inc
Purchase Details
Closed on
Apr 13, 2015
Sold by
Bai Ken B and Bai Oak N
Bought by
Sejung T and Sejung G
Purchase Details
Closed on
Sep 10, 2004
Sold by
Lasalle Bank Na
Bought by
Bai Ken B and Bai Oak N
Home Financials for this Owner
Home Financials are based on the most recent Mortgage that was taken out on this home.
Original Mortgage
$459,000
Interest Rate
6.5%
Mortgage Type
Commercial
Create a Home Valuation Report for This Property
The Home Valuation Report is an in-depth analysis detailing your home's value as well as a comparison with similar homes in the area
Home Values in the Area
Average Home Value in this Area
Purchase History
| Date | Buyer | Sale Price | Title Company |
|---|---|---|---|
| Big Squeeze Llc | $835,000 | Gmt Title | |
| The Eclipse One Llc | $435,000 | Gmt Title Agency | |
| Tgs Solution Inc | -- | None Available | |
| Sejung T | $450,000 | Precision Title | |
| Bai Ken B | $612,000 | Ticor |
Source: Public Records
Mortgage History
| Date | Status | Borrower | Loan Amount |
|---|---|---|---|
| Previous Owner | The Eclipse One Llc | $304,000 | |
| Previous Owner | Bai Ken B | $459,000 |
Source: Public Records
Tax History Compared to Growth
Tax History
| Year | Tax Paid | Tax Assessment Tax Assessment Total Assessment is a certain percentage of the fair market value that is determined by local assessors to be the total taxable value of land and additions on the property. | Land | Improvement |
|---|---|---|---|---|
| 2024 | $43,793 | $172,456 | $46,538 | $125,918 |
| 2023 | $42,136 | $172,456 | $46,538 | $125,918 |
| 2022 | $42,136 | $172,456 | $46,538 | $125,918 |
| 2021 | $30,188 | $108,748 | $46,537 | $62,211 |
| 2020 | $29,081 | $108,748 | $46,537 | $62,211 |
| 2019 | $26,475 | $108,748 | $46,537 | $62,211 |
| 2018 | $38,592 | $140,681 | $36,956 | $103,725 |
| 2017 | $38,316 | $140,681 | $36,956 | $103,725 |
| 2016 | $35,792 | $140,681 | $36,956 | $103,725 |
| 2015 | $29,785 | $111,229 | $35,587 | $75,642 |
| 2014 | $29,373 | $111,229 | $35,587 | $75,642 |
| 2013 | $28,710 | $111,229 | $35,587 | $75,642 |
Source: Public Records
Map
Nearby Homes
- 630 Perrie Dr Unit 104
- 1520 Grove Terrace
- 105 Crest Ave
- 539 Ridgewood Rd
- 510 Oakton St
- 532 Landmeier Rd
- 509 Shadywood Ln
- 50 Ridgewood Rd
- 2831 S Embers Ln Unit 352831
- 301 Forest View Ave
- 1747 W Crystal Ln Unit 308
- 2829 S Briarwood Dr E
- 865 Love St
- 1785 W Algonquin Rd Unit 2A
- 1727 W Crystal Ln Unit 208
- 1717 W Crystal Ln Unit 701
- 1717 W Crystal Ln Unit 610
- 851 Crest Ave
- 301 S Arlington Heights Rd
- 1119 E Algonquin Rd Unit 2
- 415 Lively Blvd
- 405 Lively Blvd
- 420 Crossen Ave
- 422 Crossen Ave
- 450 Crossen Ave
- 349 Lively Blvd
- 349 S Lively Blvd
- 341 Lively Blvd
- 500 Crossen Ave
- 361 Bonnie Ln Unit 102
- 361 Bonnie Ln Unit 101/102
- 475 Crossen Ave
- 300 Lively Blvd
- 495 Crossen Ave
- 343 Crossen Ave
- 350 Bonnie Ln
- 560 Lively Blvd
- 1207 Oakton St
- 1290 Brummel Ave
- 520 Bonnie Ln