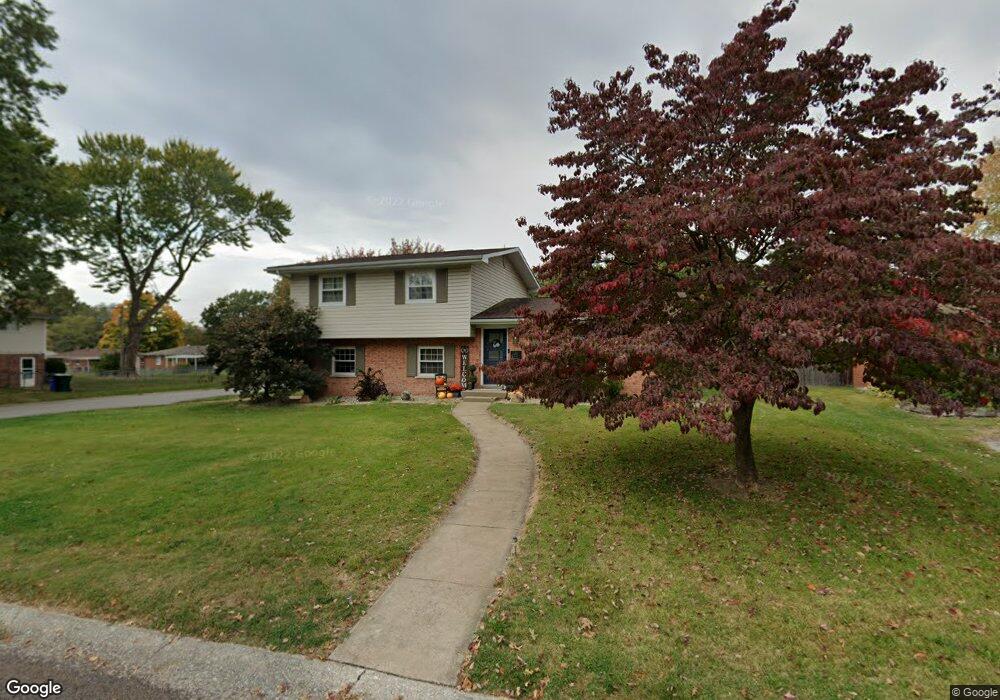
425 Longview Dr Belleville, IL 62223
Estimated Value: $187,713 - $240,000
Studio
--
Bath
624
Sq Ft
$325/Sq Ft
Est. Value
About This Home
This home is located at 425 Longview Dr, Belleville, IL 62223 and is currently estimated at $202,678, approximately $324 per square foot. 425 Longview Dr is a home located in St. Clair County with nearby schools including Ellis Elementary School, Emge Junior High School, and Our Lady Queen Of Peace Catholic School.
Ownership History
Date
Name
Owned For
Owner Type
Purchase Details
Closed on
Dec 4, 2020
Sold by
Bluegrass Premier Homes
Bought by
Meridith Jennifer M
Current Estimated Value
Home Financials for this Owner
Home Financials are based on the most recent Mortgage that was taken out on this home.
Original Mortgage
$166,918
Outstanding Balance
$148,872
Interest Rate
2.8%
Mortgage Type
FHA
Estimated Equity
$53,806
Purchase Details
Closed on
Feb 5, 2020
Sold by
Roberts Derek N
Bought by
Bluegrass Premier Homes
Purchase Details
Closed on
Dec 23, 2002
Sold by
Brawley Karla Kay
Bought by
Roberts Derek N
Home Financials for this Owner
Home Financials are based on the most recent Mortgage that was taken out on this home.
Original Mortgage
$102,000
Interest Rate
6.01%
Mortgage Type
Purchase Money Mortgage
Create a Home Valuation Report for This Property
The Home Valuation Report is an in-depth analysis detailing your home's value as well as a comparison with similar homes in the area
Home Values in the Area
Average Home Value in this Area
Purchase History
| Date | Buyer | Sale Price | Title Company |
|---|---|---|---|
| Meridith Jennifer M | $170,000 | Community Title Shiloh Llc | |
| Bluegrass Premier Homes | $77,500 | None Available | |
| Roberts Derek N | $102,000 | First American Title |
Source: Public Records
Mortgage History
| Date | Status | Borrower | Loan Amount |
|---|---|---|---|
| Open | Meridith Jennifer M | $166,918 | |
| Previous Owner | Roberts Derek N | $102,000 |
Source: Public Records
Tax History
| Year | Tax Paid | Tax Assessment Tax Assessment Total Assessment is a certain percentage of the fair market value that is determined by local assessors to be the total taxable value of land and additions on the property. | Land | Improvement |
|---|---|---|---|---|
| 2024 | $4,940 | $53,821 | $7,944 | $45,877 |
| 2023 | $4,226 | $43,878 | $7,787 | $36,091 |
| 2022 | $3,948 | $39,501 | $7,010 | $32,491 |
| 2021 | $3,820 | $36,518 | $6,481 | $30,037 |
| 2020 | $3,738 | $34,534 | $6,129 | $28,405 |
| 2019 | $3,186 | $34,873 | $6,140 | $28,733 |
| 2018 | $3,115 | $34,119 | $6,007 | $28,112 |
| 2017 | $3,116 | $33,878 | $5,964 | $27,914 |
| 2016 | $3,079 | $33,158 | $5,837 | $27,321 |
| 2014 | $2,579 | $32,531 | $5,988 | $26,543 |
| 2013 | $2,547 | $32,997 | $6,074 | $26,923 |
Source: Public Records
Map
Nearby Homes
- 125 Chevy Chase Dr
- 311 Chevy Chase Dr
- 508 Rosewood Dr
- 213 Springdale Dr
- 408 Southgate Dr
- 1242 Express Dr Unit 1242/1244
- 69 Country Club Acres
- 2245 Frank Scott Pkwy W
- 2241 Frank Scott Pkwy W
- 2264 Frank Scott Pkwy W
- 7000 Gary Dr
- 21 S 57th St
- 425 S 47th St
- 6317 W Washington St
- 6316 W Main St
- 922 S 74th St
- 7117 Gary Dr
- 2819 Frank Scott Pkwy W
- 101 Sheffield Dr
- 1503 Hampton Ct
- 421 Longview Dr
- 200 Brittany Ln
- 501 Longview Dr
- 204 Brittany Ln
- 424 Longview Dr
- 132 Brittany Ln
- 417 Longview Dr
- 420 Longview Dr
- 208 Brittany Ln
- 500 Longview Dr
- 128 Brittany Ln
- 416 Longview Dr
- 413 Longview Dr
- 504 Longview Dr
- 509 Longview Dr
- 212 Brittany Ln
- 523 Springdale Dr
- 201 Brittany Ln
- 124 Brittany Ln
- 519 Springdale Dr
Your Personal Tour Guide
Ask me questions while you tour the home.