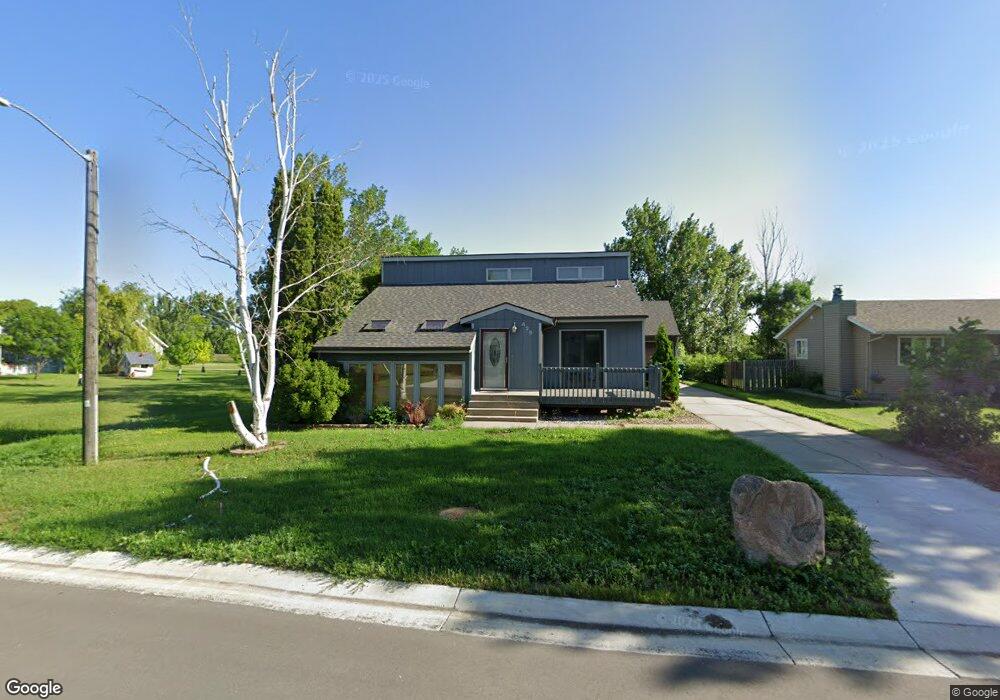
425 Maple Dr Mapleton, ND 58059
Estimated Value: $276,286 - $303,000
3
Beds
2
Baths
1,653
Sq Ft
$173/Sq Ft
Est. Value
About This Home
This home is located at 425 Maple Dr, Mapleton, ND 58059 and is currently estimated at $285,822, approximately $172 per square foot. 425 Maple Dr is a home located in Cass County with nearby schools including Mapleton Elementary School.
Ownership History
Date
Name
Owned For
Owner Type
Purchase Details
Closed on
Jul 22, 2019
Sold by
Gamel Cheryl and Gamel Bruce
Bought by
Linder Justin J
Current Estimated Value
Home Financials for this Owner
Home Financials are based on the most recent Mortgage that was taken out on this home.
Original Mortgage
$220,400
Outstanding Balance
$193,090
Interest Rate
3.82%
Mortgage Type
New Conventional
Estimated Equity
$92,732
Purchase Details
Closed on
Sep 30, 2009
Sold by
Gamel Cheryl and Gamel Bruce
Bought by
Gamel Cheryl and Gamel Bruce
Home Financials for this Owner
Home Financials are based on the most recent Mortgage that was taken out on this home.
Original Mortgage
$140,000
Interest Rate
5.19%
Mortgage Type
New Conventional
Create a Home Valuation Report for This Property
The Home Valuation Report is an in-depth analysis detailing your home's value as well as a comparison with similar homes in the area
Purchase History
| Date | Buyer | Sale Price | Title Company |
|---|---|---|---|
| Linder Justin J | $232,000 | Title Co | |
| Gamel Cheryl | -- | -- |
Source: Public Records
Mortgage History
| Date | Status | Borrower | Loan Amount |
|---|---|---|---|
| Open | Linder Justin J | $220,400 | |
| Previous Owner | Gamel Cheryl | $140,000 |
Source: Public Records
Tax History
| Year | Tax Paid | Tax Assessment Tax Assessment Total Assessment is a certain percentage of the fair market value that is determined by local assessors to be the total taxable value of land and additions on the property. | Land | Improvement |
|---|---|---|---|---|
| 2024 | $3,161 | $129,050 | $19,450 | $109,600 |
| 2023 | $3,559 | $127,600 | $19,450 | $108,150 |
| 2022 | $3,052 | $117,100 | $19,450 | $97,650 |
| 2021 | $2,896 | $107,400 | $15,050 | $92,350 |
| 2020 | $2,752 | $104,300 | $15,050 | $89,250 |
| 2019 | $2,605 | $97,650 | $15,050 | $82,600 |
| 2018 | $2,637 | $97,650 | $15,050 | $82,600 |
| 2017 | $2,584 | $96,150 | $15,050 | $81,100 |
| 2016 | $1,806 | $86,050 | $6,700 | $79,350 |
| 2015 | $1,602 | $79,650 | $6,200 | $73,450 |
| 2014 | $1,572 | $72,400 | $5,650 | $66,750 |
| 2013 | $1,598 | $72,400 | $5,650 | $66,750 |
Source: Public Records
Map
Nearby Homes
Your Personal Tour Guide
Ask me questions while you tour the home.