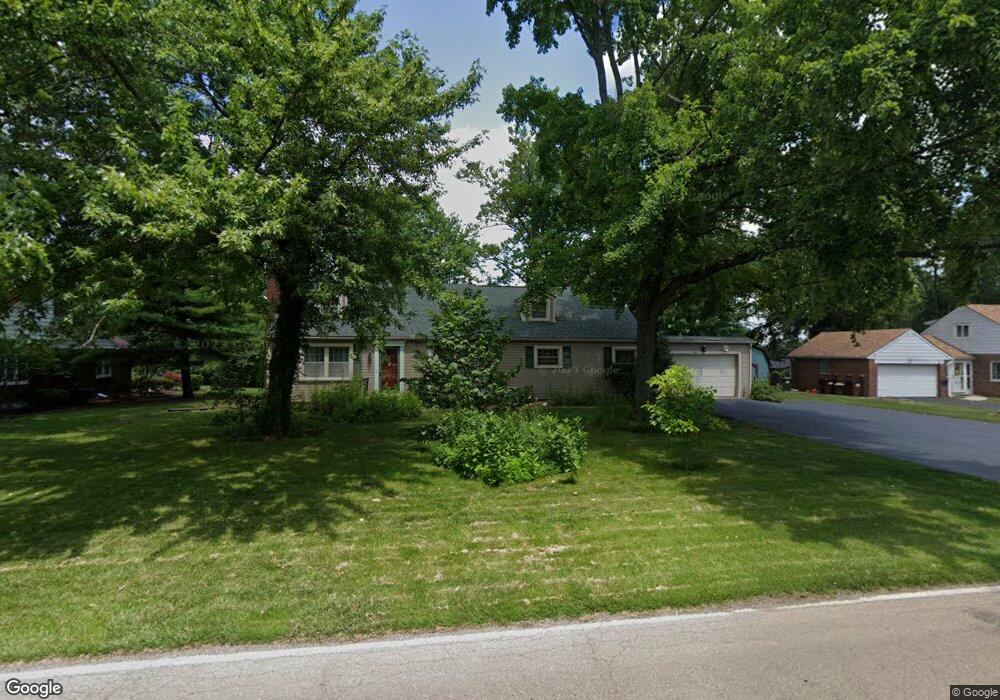
425 Marlay Rd Dayton, OH 45405
Fort McKinley NeighborhoodEstimated Value: $186,000 - $262,000
3
Beds
3
Baths
2,014
Sq Ft
$109/Sq Ft
Est. Value
About This Home
This home is located at 425 Marlay Rd, Dayton, OH 45405 and is currently estimated at $218,814, approximately $108 per square foot. 425 Marlay Rd is a home located in Montgomery County with nearby schools including Valerie Elementary School, Horizon Science Academy-Dayton Elementary School, and Imagine Klepinger Road Community School.
Ownership History
Date
Name
Owned For
Owner Type
Purchase Details
Closed on
Sep 14, 2019
Sold by
Estate Of Kendall K Mccabe
Bought by
Weily Michael
Current Estimated Value
Purchase Details
Closed on
Sep 13, 2019
Sold by
Estate Of Kendall K Mccabe
Bought by
Welly Michael
Purchase Details
Closed on
Mar 24, 2000
Sold by
Kunz Jean
Bought by
Mccabe Kendall K
Home Financials for this Owner
Home Financials are based on the most recent Mortgage that was taken out on this home.
Original Mortgage
$89,600
Interest Rate
8.39%
Purchase Details
Closed on
Mar 20, 2000
Sold by
Koverman George R and Kunz Lewis
Bought by
Kunz Jean
Home Financials for this Owner
Home Financials are based on the most recent Mortgage that was taken out on this home.
Original Mortgage
$89,600
Interest Rate
8.39%
Purchase Details
Closed on
Jul 15, 1997
Sold by
Blatt Noel F and Blatt Elva Lena
Bought by
Koverman George R and Kunz Lewis
Create a Home Valuation Report for This Property
The Home Valuation Report is an in-depth analysis detailing your home's value as well as a comparison with similar homes in the area
Home Values in the Area
Average Home Value in this Area
Purchase History
| Date | Buyer | Sale Price | Title Company |
|---|---|---|---|
| Weily Michael | -- | None Available | |
| Welly Michael | -- | None Available | |
| Mccabe Kendall K | $112,000 | -- | |
| Kunz Jean | -- | -- | |
| Koverman George R | -- | -- | |
| Koverman George R | $98,000 | -- |
Source: Public Records
Mortgage History
| Date | Status | Borrower | Loan Amount |
|---|---|---|---|
| Previous Owner | Mccabe Kendall K | $89,600 |
Source: Public Records
Tax History Compared to Growth
Tax History
| Year | Tax Paid | Tax Assessment Tax Assessment Total Assessment is a certain percentage of the fair market value that is determined by local assessors to be the total taxable value of land and additions on the property. | Land | Improvement |
|---|---|---|---|---|
| 2024 | $2,230 | $39,300 | $7,620 | $31,680 |
| 2023 | $2,230 | $39,300 | $7,620 | $31,680 |
| 2022 | $2,875 | $28,060 | $5,440 | $22,620 |
| 2021 | $2,755 | $28,060 | $5,440 | $22,620 |
| 2020 | $2,791 | $28,060 | $5,440 | $22,620 |
| 2019 | $1,867 | $25,440 | $5,440 | $20,000 |
| 2018 | $1,869 | $25,440 | $5,440 | $20,000 |
| 2017 | $1,859 | $25,440 | $5,440 | $20,000 |
| 2016 | $1,799 | $24,310 | $5,440 | $18,870 |
| 2015 | $1,574 | $24,310 | $5,440 | $18,870 |
| 2014 | $1,574 | $24,310 | $5,440 | $18,870 |
| 2012 | -- | $36,500 | $9,100 | $27,400 |
Source: Public Records
Map
Nearby Homes
- 3114 Marlay Rd
- 4261 Briar Place
- 3122 Garvin Rd Unit 8
- 3130 Garvin Rd Unit 12
- 0 Haney Rd E Unit 937713
- 126 Allerton Rd
- 209 Julia Ave
- 519 Heather Dr
- 111 Folsom Dr
- 138 Northwood Ave
- 721 Golfview Ave
- 15 Wampler Ave
- 210 Castlewood Ave
- 4601 Merrick Dr Unit 79
- 158 Loretta Dr
- 3539 Detroit Ave
- 2537 Ravenwood Ave
- 4535 Lansmore Dr Unit 97
- 5308 N Main St
- 244 Castlewood Ave