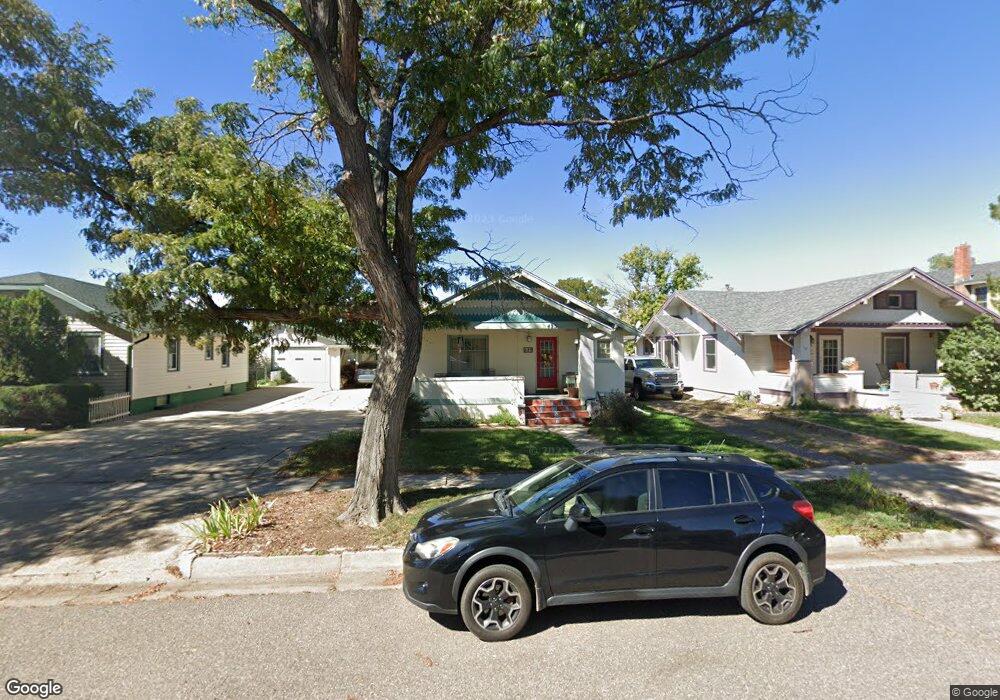
425 S 3rd Ave Brighton, CO 80601
Estimated Value: $414,000 - $539,000
4
Beds
1
Bath
1,886
Sq Ft
$246/Sq Ft
Est. Value
About This Home
This home is located at 425 S 3rd Ave, Brighton, CO 80601 and is currently estimated at $464,587, approximately $246 per square foot. 425 S 3rd Ave is a home located in Adams County with nearby schools including South Elementary School, Vikan Middle School, and Brighton High School.
Ownership History
Date
Name
Owned For
Owner Type
Purchase Details
Closed on
Sep 15, 2000
Sold by
Wenger Harold L and Wenger Jody K
Bought by
Curran Victoria E
Current Estimated Value
Home Financials for this Owner
Home Financials are based on the most recent Mortgage that was taken out on this home.
Original Mortgage
$111,200
Outstanding Balance
$38,056
Interest Rate
8.01%
Estimated Equity
$426,531
Purchase Details
Closed on
Sep 2, 1993
Sold by
Barba Carol J
Bought by
Wenger Harold L and Wenger Jody K
Home Financials for this Owner
Home Financials are based on the most recent Mortgage that was taken out on this home.
Original Mortgage
$65,353
Interest Rate
7.23%
Mortgage Type
FHA
Create a Home Valuation Report for This Property
The Home Valuation Report is an in-depth analysis detailing your home's value as well as a comparison with similar homes in the area
Home Values in the Area
Average Home Value in this Area
Purchase History
| Date | Buyer | Sale Price | Title Company |
|---|---|---|---|
| Curran Victoria E | $139,000 | -- | |
| Wenger Harold L | $65,000 | -- |
Source: Public Records
Mortgage History
| Date | Status | Borrower | Loan Amount |
|---|---|---|---|
| Open | Curran Victoria E | $111,200 | |
| Previous Owner | Wenger Harold L | $65,353 | |
| Closed | Curran Victoria E | $13,900 |
Source: Public Records
Tax History
| Year | Tax Paid | Tax Assessment Tax Assessment Total Assessment is a certain percentage of the fair market value that is determined by local assessors to be the total taxable value of land and additions on the property. | Land | Improvement |
|---|---|---|---|---|
| 2025 | $2,245 | $29,920 | $5,780 | $24,140 |
| 2024 | $2,245 | $27,500 | $5,310 | $22,190 |
| 2023 | $2,235 | $30,780 | $5,410 | $25,370 |
| 2022 | $1,550 | $21,060 | $4,930 | $16,130 |
| 2021 | $1,453 | $21,060 | $4,930 | $16,130 |
| 2020 | $1,456 | $21,890 | $4,860 | $17,030 |
| 2019 | $2,164 | $21,890 | $4,860 | $17,030 |
| 2018 | $1,697 | $17,160 | $4,750 | $12,410 |
| 2017 | $1,695 | $17,160 | $4,750 | $12,410 |
| 2016 | $1,128 | $11,380 | $2,390 | $8,990 |
| 2015 | $1,125 | $11,380 | $2,390 | $8,990 |
| 2014 | -- | $13,470 | $1,910 | $11,560 |
Source: Public Records
Map
Nearby Homes
- 475 S 2nd Ave
- 475 S 2nd Ave Unit Plot 1
- 303 S 2nd Ave
- 219 S 3rd Ave
- 648 S 3rd Ave
- 204 E Egbert St
- 617 S 5th Ave
- 135 S 3rd Ave
- 113 S 4th Ave
- 107 S 4th Ave
- 230 Ash Ave Unit 4
- 765 S 1st Ave
- 784 S 3rd Ave
- 285 S 8th Ave
- 362 Dogwood Ave
- 141 E Bromley Ln
- 175 S 10th Ave
- 126 S 9th Ave
- 865 S 8th Ave
- 835 S 9th Ave
Your Personal Tour Guide
Ask me questions while you tour the home.