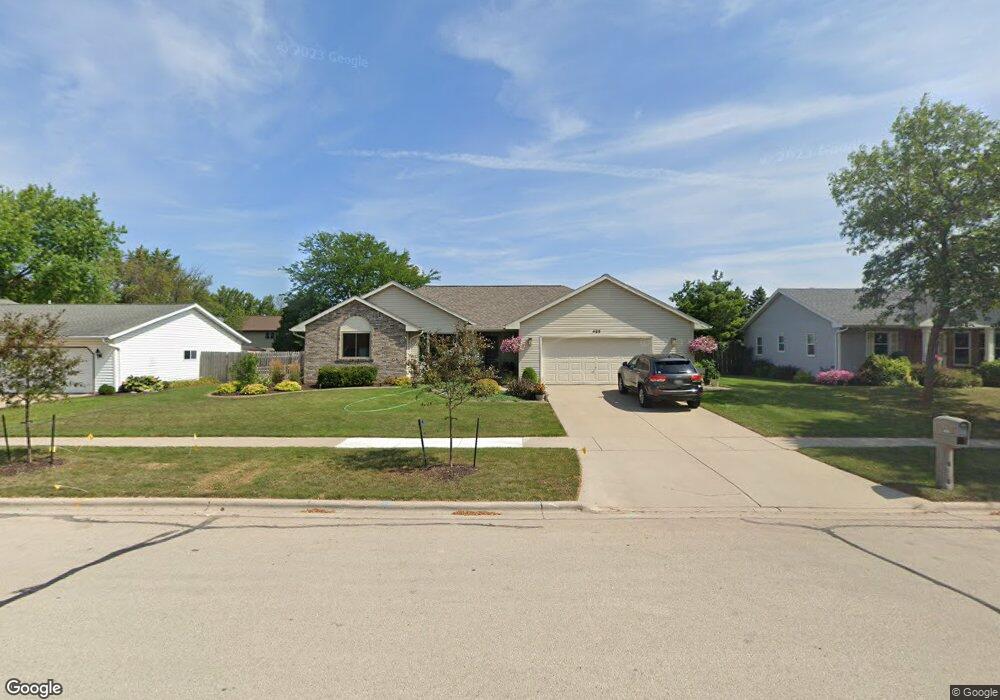
425 S Good Hope Rd de Pere, WI 54115
Estimated Value: $366,000 - $428,000
3
Beds
3
Baths
2,664
Sq Ft
$151/Sq Ft
Est. Value
About This Home
This home is located at 425 S Good Hope Rd, de Pere, WI 54115 and is currently estimated at $402,503, approximately $151 per square foot. 425 S Good Hope Rd is a home located in Brown County with nearby schools including Susie C. Altmayer Elementary School, Foxview Intermediate School, and De Pere Middle School.
Ownership History
Date
Name
Owned For
Owner Type
Purchase Details
Closed on
May 7, 2025
Sold by
Rieder Jerry M and Schroeder Leesha
Bought by
Rieder Jerry M and Rieder Leesha A
Current Estimated Value
Purchase Details
Closed on
Jun 8, 2004
Sold by
Alexander Jeffrey R and Alexander Kathleen Paig
Bought by
Rieder Jerry M and Schroeder Leesha
Home Financials for this Owner
Home Financials are based on the most recent Mortgage that was taken out on this home.
Original Mortgage
$142,800
Interest Rate
6.17%
Mortgage Type
Purchase Money Mortgage
Purchase Details
Closed on
Nov 30, 1998
Sold by
Smoot Charles G and Smoot Jennifer A
Bought by
Alexander Jeffrey R and Alexander Kathleen Paig
Home Financials for this Owner
Home Financials are based on the most recent Mortgage that was taken out on this home.
Original Mortgage
$110,400
Interest Rate
6.5%
Create a Home Valuation Report for This Property
The Home Valuation Report is an in-depth analysis detailing your home's value as well as a comparison with similar homes in the area
Home Values in the Area
Average Home Value in this Area
Purchase History
| Date | Buyer | Sale Price | Title Company |
|---|---|---|---|
| Rieder Jerry M | -- | -- | |
| Rieder Jerry M | $178,500 | Liberty Title | |
| Alexander Jeffrey R | $138,000 | Evans Title |
Source: Public Records
Mortgage History
| Date | Status | Borrower | Loan Amount |
|---|---|---|---|
| Previous Owner | Rieder Jerry M | $142,800 | |
| Previous Owner | Alexander Jeffrey R | $110,400 |
Source: Public Records
Tax History Compared to Growth
Tax History
| Year | Tax Paid | Tax Assessment Tax Assessment Total Assessment is a certain percentage of the fair market value that is determined by local assessors to be the total taxable value of land and additions on the property. | Land | Improvement |
|---|---|---|---|---|
| 2024 | $4,742 | $335,500 | $37,600 | $297,900 |
| 2023 | $4,298 | $316,800 | $37,600 | $279,200 |
| 2022 | $3,936 | $275,700 | $37,600 | $238,100 |
| 2021 | $3,733 | $247,700 | $31,400 | $216,300 |
| 2020 | $3,780 | $228,900 | $31,400 | $197,500 |
| 2019 | $3,869 | $215,100 | $31,400 | $183,700 |
| 2018 | $4,018 | $203,300 | $31,400 | $171,900 |
| 2017 | $3,699 | $182,100 | $31,400 | $150,700 |
| 2016 | $3,754 | $182,100 | $31,400 | $150,700 |
| 2015 | $3,748 | $173,500 | $33,400 | $140,100 |
| 2014 | $3,694 | $173,500 | $33,400 | $140,100 |
| 2013 | $3,694 | $173,500 | $33,400 | $140,100 |
Source: Public Records
Map
Nearby Homes
- 717 4th St
- 806 4th St
- 830 S Superior St Unit 832
- 1120 Cardinal St
- 235 Autumn Dr
- 801 S Erie St
- 1410 S 7th St
- 1379 Graystone Ct
- 1509 S 7th St
- 2080 Greenleaf Rd
- 0 S Broadway St
- 1144 Jordan Rd
- 1734 Revere Trail
- 0 N Stellita Cir Unit 50263856
- 0 N Stellita Cir Unit 50263853
- 634 Grant St
- 555 Main Ave Unit 110
- 555 Main Ave Unit 104
- 555 Main Ave Unit 111
- 555 Main Ave Unit 206
- 431 S Good Hope Rd
- 428 S Fox Croft Dr
- 434 S Fox Croft Dr
- 422 S Fox Croft Dr
- 435 S Good Hope Rd
- 413 S Good Hope Rd
- 426 S Good Hope Rd
- 440 S Fox Croft Dr
- 432 S Good Hope Rd
- 414 S Good Hope Rd
- 416 S Fox Croft Dr
- 443 S Good Hope Rd
- 407 S Good Hope Rd
- 438 S Good Hope Rd
- 408 S Good Hope Rd
- 446 S Fox Croft Dr
- 427 S Fox Croft Dr
- 410 S Fox Croft Dr
- 425 Landsborough Ct
- 417 Landsborough Ct Unit 3