Estimated Value: $1,013,000 - $1,299,346
--
Bed
4
Baths
6,220
Sq Ft
$183/Sq Ft
Est. Value
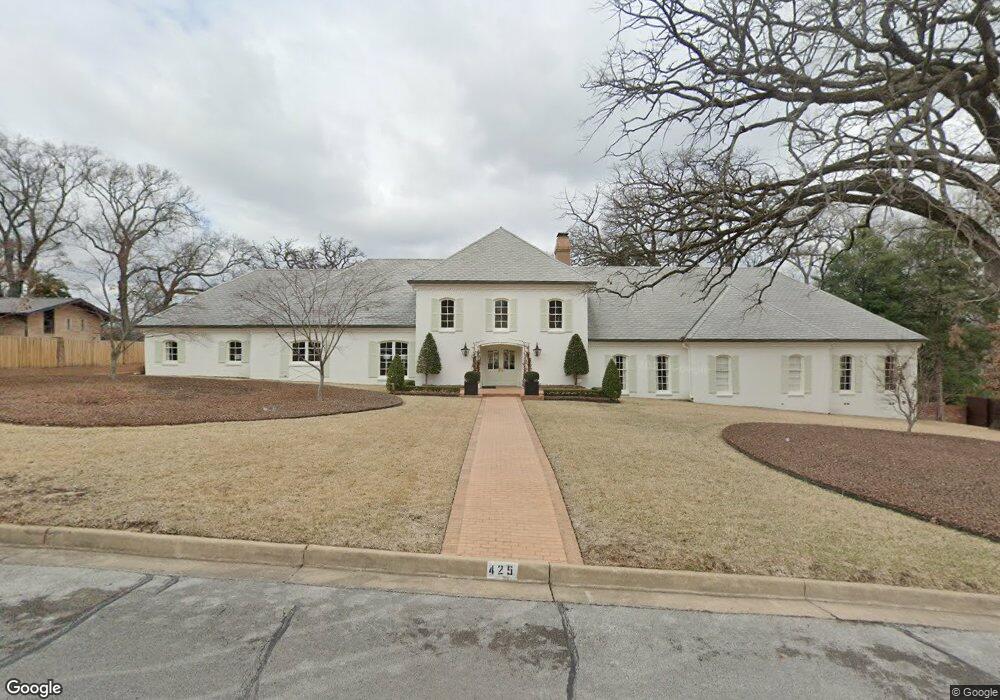
About This Home
This home is located at 425 Sherry Ln, Tyler, TX 75701 and is currently estimated at $1,139,115, approximately $183 per square foot. 425 Sherry Ln is a home located in Smith County with nearby schools including Woods Elementary School, Hubbard Middle School, and Tyler Legacy High School.
Ownership History
Date
Name
Owned For
Owner Type
Purchase Details
Closed on
Jan 12, 2011
Sold by
Whisenant Paula Marlene Wisenbaker and Estate Of Clorinda M D Wisenba
Bought by
Lewis Michael R and Lewis Courtney O
Current Estimated Value
Home Financials for this Owner
Home Financials are based on the most recent Mortgage that was taken out on this home.
Original Mortgage
$547,731
Interest Rate
4.73%
Mortgage Type
Purchase Money Mortgage
Purchase Details
Closed on
Jan 11, 2011
Sold by
Whisenant Paula Marlene Wisenbaker and Estate Of Clorinda M D Wisenba
Bought by
Lewis Michael R and Lewis Courtney O
Home Financials for this Owner
Home Financials are based on the most recent Mortgage that was taken out on this home.
Original Mortgage
$547,731
Interest Rate
4.73%
Mortgage Type
Purchase Money Mortgage
Create a Home Valuation Report for This Property
The Home Valuation Report is an in-depth analysis detailing your home's value as well as a comparison with similar homes in the area
Home Values in the Area
Average Home Value in this Area
Purchase History
| Date | Buyer | Sale Price | Title Company |
|---|---|---|---|
| Lewis Michael R | -- | None Available | |
| Lewis Michael R | -- | None Available | |
| Lewis Michael R | -- | None Available | |
| Lewis Michael R | -- | None Available |
Source: Public Records
Mortgage History
| Date | Status | Borrower | Loan Amount |
|---|---|---|---|
| Previous Owner | Lewis Michael R | $547,731 | |
| Previous Owner | Lewis Michael R | $547,731 |
Source: Public Records
Tax History Compared to Growth
Tax History
| Year | Tax Paid | Tax Assessment Tax Assessment Total Assessment is a certain percentage of the fair market value that is determined by local assessors to be the total taxable value of land and additions on the property. | Land | Improvement |
|---|---|---|---|---|
| 2025 | $17,522 | $1,299,457 | $192,120 | $1,107,337 |
| 2024 | $17,522 | $1,101,810 | $192,120 | $1,107,337 |
| 2023 | $17,460 | $1,299,457 | $192,120 | $1,107,337 |
| 2022 | $17,840 | $1,131,102 | $128,080 | $1,003,022 |
| 2021 | $17,368 | $827,805 | $128,080 | $699,725 |
| 2020 | $18,642 | $871,204 | $144,910 | $726,294 |
| 2019 | $17,605 | $805,092 | $144,910 | $660,182 |
| 2018 | $17,432 | $801,494 | $144,910 | $656,584 |
| 2017 | $17,111 | $801,494 | $144,910 | $656,584 |
| 2016 | $16,558 | $775,595 | $144,910 | $630,685 |
| 2015 | $16,302 | $767,661 | $144,910 | $622,751 |
| 2014 | $16,302 | $785,006 | $144,910 | $640,096 |
Source: Public Records
Map
Nearby Homes
- 3308 Greenoak Place
- 505 Buckingham Place
- 509 Buckingham Place
- 3300 Old Bullard Rd
- 3617 Jill Cir
- 403 Beechwood Dr
- 504 Woodland Hills Dr
- 612 Rosemont Place II
- 604-606 Woodland Hills Dr
- 3324 Teakwood Dr
- 640 Beechwood Dr
- 410 Brighton Ct
- 701 Woodland Hills Dr
- 815 Woodland Hills Dr
- 3606 Glendale Dr
- 2917 Sunnybrook Dr
- 0 Us Highway 271
- 1111 Beechwood Dr
- 121 Fair Ln
- 3500 Silverwood Dr
- 504 Rudman Rd
- 410 410 Rudman
- 507 Sherry Ln
- 410 Rudman Rd
- 440 Sherry Ln
- 506 Rudman Rd
- 420 Sherry Ln
- 507 Rudman Rd
- 517 Sherry Ln
- 510 Sherry Ln
- 518 Rudman Rd
- 3600 Jill Cir
- 410 Sherry Ln
- 3316 Parliament Dr
- 3601 Old Bullard Rd
- 3606 Jill Cir
- 3314 3314 Parliament
- 3605 Jill Cir
- 3314 Parliament Dr
- 500 Hyde Park Dr