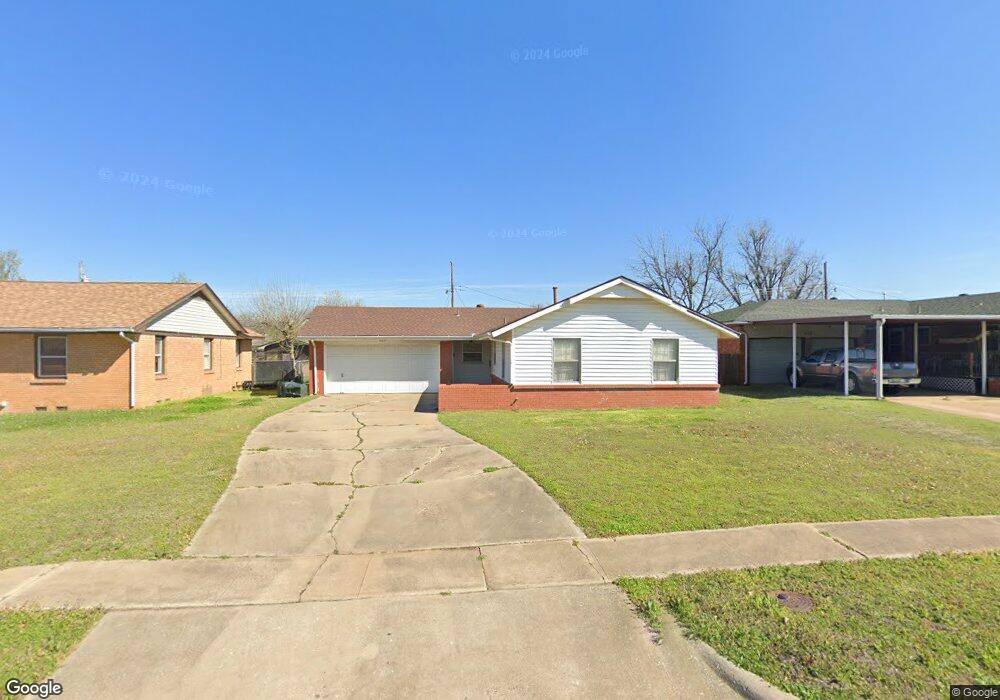
425 W Ercoupe Dr Oklahoma City, OK 73110
Estimated Value: $115,000 - $133,000
3
Beds
1
Bath
1,014
Sq Ft
$124/Sq Ft
Est. Value
About This Home
This home is located at 425 W Ercoupe Dr, Oklahoma City, OK 73110 and is currently estimated at $125,545, approximately $123 per square foot. 425 W Ercoupe Dr is a home located in Oklahoma County with nearby schools including Midwest City Middle School, Midwest City High School, and St Philip Neri School.
Ownership History
Date
Name
Owned For
Owner Type
Purchase Details
Closed on
Sep 18, 2025
Sold by
Knighten Carl B
Bought by
Jones Jeremiah M
Current Estimated Value
Home Financials for this Owner
Home Financials are based on the most recent Mortgage that was taken out on this home.
Original Mortgage
$64,000
Outstanding Balance
$64,000
Interest Rate
6.58%
Mortgage Type
New Conventional
Estimated Equity
$61,545
Purchase Details
Closed on
Apr 7, 2024
Sold by
Knighten Carl B
Bought by
Perez Investments Llc
Purchase Details
Closed on
Aug 1, 2000
Sold by
Martinez Gina M and Martinez Richard L
Bought by
Knighten Carl B
Home Financials for this Owner
Home Financials are based on the most recent Mortgage that was taken out on this home.
Original Mortgage
$41,411
Interest Rate
8.22%
Mortgage Type
FHA
Purchase Details
Closed on
Nov 5, 1999
Sold by
Parton Doyle D
Bought by
Martinez Gina M
Create a Home Valuation Report for This Property
The Home Valuation Report is an in-depth analysis detailing your home's value as well as a comparison with similar homes in the area
Home Values in the Area
Average Home Value in this Area
Purchase History
| Date | Buyer | Sale Price | Title Company |
|---|---|---|---|
| Jones Jeremiah M | $64,000 | None Listed On Document | |
| Jones Jeremiah M | $64,000 | None Listed On Document | |
| Perez Investments Llc | $90,000 | None Listed On Document | |
| Knighten Carl B | $45,000 | First American Title & Tr Co | |
| Martinez Gina M | -- | -- |
Source: Public Records
Mortgage History
| Date | Status | Borrower | Loan Amount |
|---|---|---|---|
| Open | Jones Jeremiah M | $64,000 | |
| Closed | Jones Jeremiah M | $64,000 | |
| Closed | Knighten Carl B | $41,411 |
Source: Public Records
Tax History Compared to Growth
Tax History
| Year | Tax Paid | Tax Assessment Tax Assessment Total Assessment is a certain percentage of the fair market value that is determined by local assessors to be the total taxable value of land and additions on the property. | Land | Improvement |
|---|---|---|---|---|
| 2024 | $1,124 | $10,027 | $2,261 | $7,766 |
| 2023 | $1,124 | $9,549 | $1,659 | $7,890 |
| 2022 | $1,061 | $9,095 | $1,755 | $7,340 |
| 2021 | $1,035 | $8,662 | $1,936 | $6,726 |
| 2020 | $1,013 | $8,250 | $2,015 | $6,235 |
| 2019 | $995 | $8,470 | $1,844 | $6,626 |
| 2018 | $897 | $8,140 | $0 | $0 |
| 2017 | $905 | $8,084 | $1,844 | $6,240 |
| 2016 | $924 | $8,029 | $1,844 | $6,185 |
| 2015 | $948 | $7,915 | $1,751 | $6,164 |
| 2014 | $927 | $7,748 | $1,751 | $5,997 |
Source: Public Records
Map
Nearby Homes
- 417 W Douglas Dr
- 408 W Douglas Dr
- 601 Foster Place
- 608 W Rickenbacker Dr
- 311 W Lilac Ln
- 504 E Rickenbacker Dr
- 516 E Rickenbacker Dr
- 102 E Lilac Ln
- 217 E Douglas Dr
- 104 E Northrup Dr
- 305 E Ercoupe Dr
- 109 E Northrup Dr
- 311 E Grumman Dr
- 314 E Ercoupe Dr
- 210 E Myrtle Dr
- 202 E Northrup Dr
- 1613 Sandra Dr
- 1800 N Mitchell Dr
- 511 N Key Blvd
- 1701 Rulane Dr
- 427 W Ercoupe Dr
- 423 W Ercoupe Dr
- 429 W Ercoupe Dr
- 426 W Fairchild Dr
- 421 W Ercoupe Dr
- 424 W Fairchild Dr
- 428 W Fairchild Dr
- 422 W Fairchild Dr
- 424 W Ercoupe Dr
- 422 W Ercoupe Dr
- 426 W Ercoupe Dr
- 431 W Ercoupe Dr
- 419 W Ercoupe Dr
- 420 W Fairchild Dr
- 420 W Ercoupe Dr
- 428 W Ercoupe Dr
- 432 W Fairchild Dr
- 418 W Fairchild Dr
- 417 W Ercoupe Dr
- 433 W Ercoupe Dr