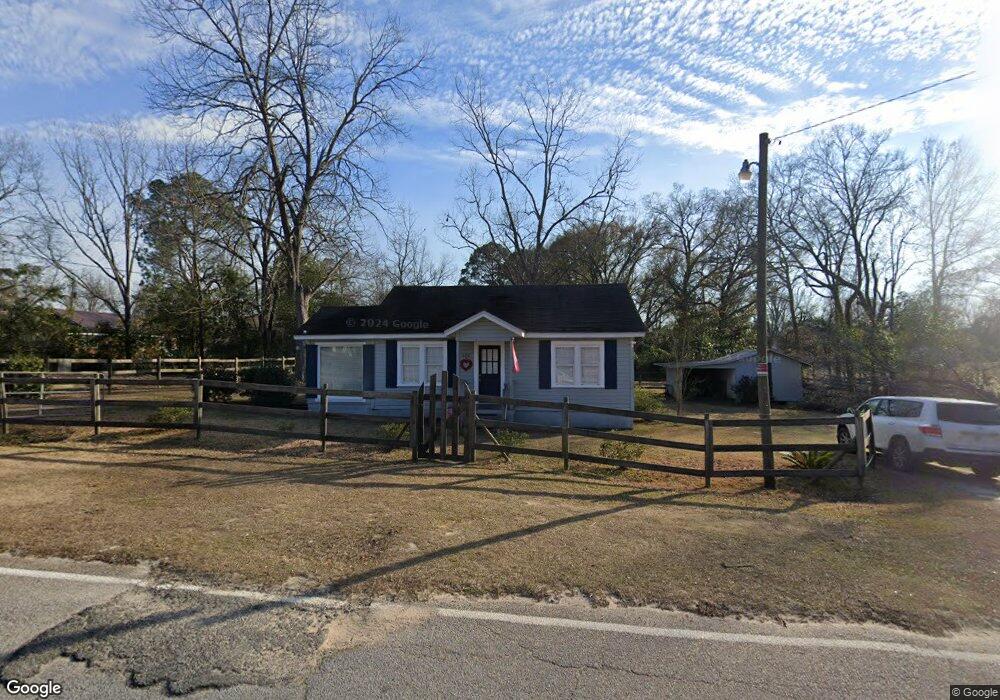
425 W Lee St Metter, GA 30439
Estimated Value: $59,949 - $101,000
--
Bed
1
Bath
780
Sq Ft
$96/Sq Ft
Est. Value
About This Home
This home is located at 425 W Lee St, Metter, GA 30439 and is currently estimated at $74,987, approximately $96 per square foot. 425 W Lee St is a home located in Candler County with nearby schools including Metter Elementary School, Metter Intermediate School, and Metter Middle School.
Ownership History
Date
Name
Owned For
Owner Type
Purchase Details
Closed on
Aug 30, 2022
Sold by
Woodcock Karen B
Bought by
Bdw Holdings Int Llc
Current Estimated Value
Home Financials for this Owner
Home Financials are based on the most recent Mortgage that was taken out on this home.
Original Mortgage
$42,500
Outstanding Balance
$18,279
Interest Rate
4.99%
Mortgage Type
New Conventional
Estimated Equity
$56,708
Purchase Details
Closed on
Oct 17, 2008
Sold by
C & M Land Development Llc
Bought by
Woodcock Karen B
Purchase Details
Closed on
Mar 5, 2008
Sold by
Briarcreek Properties Inc
Bought by
C & M Land Development Llc
Purchase Details
Closed on
Oct 3, 2007
Sold by
Countrywide Home Loans Inc
Bought by
Federal National Mortgage Association
Purchase Details
Closed on
May 14, 1997
Sold by
Sparks Cullen
Bought by
Sparks Larry and Sparks Patr
Purchase Details
Closed on
Jan 1, 1970
Bought by
Sparks Cullen
Create a Home Valuation Report for This Property
The Home Valuation Report is an in-depth analysis detailing your home's value as well as a comparison with similar homes in the area
Home Values in the Area
Average Home Value in this Area
Purchase History
| Date | Buyer | Sale Price | Title Company |
|---|---|---|---|
| Bdw Holdings Int Llc | $50,000 | -- | |
| Woodcock Karen B | $60,000 | -- | |
| C & M Land Development Llc | $26,250 | -- | |
| Briarcreek Properties Inc | $26,250 | -- | |
| Federal National Mortgage Association | -- | -- | |
| Countrywiode Home Loan Inc | -- | -- | |
| Sparks Larry | $25,000 | -- | |
| Sparks Cullen | -- | -- |
Source: Public Records
Mortgage History
| Date | Status | Borrower | Loan Amount |
|---|---|---|---|
| Open | Bdw Holdings Int Llc | $42,500 |
Source: Public Records
Tax History Compared to Growth
Tax History
| Year | Tax Paid | Tax Assessment Tax Assessment Total Assessment is a certain percentage of the fair market value that is determined by local assessors to be the total taxable value of land and additions on the property. | Land | Improvement |
|---|---|---|---|---|
| 2024 | $1,102 | $21,169 | $3,780 | $17,389 |
| 2023 | $1,050 | $20,218 | $3,780 | $16,438 |
| 2022 | $857 | $21,308 | $3,780 | $17,528 |
| 2021 | $744 | $18,884 | $3,780 | $15,104 |
| 2020 | $745 | $18,884 | $3,780 | $15,104 |
| 2019 | $840 | $21,135 | $2,970 | $18,165 |
| 2018 | $772 | $19,369 | $2,970 | $16,399 |
| 2017 | $712 | $21,259 | $4,860 | $16,399 |
| 2016 | $822 | $21,259 | $4,860 | $16,399 |
| 2015 | $805 | $21,494 | $4,860 | $16,635 |
| 2014 | $805 | $21,495 | $4,860 | $16,635 |
Source: Public Records
Map
Nearby Homes
- 40 Hickory St
- 221 S College St
- 250 S Lewis St
- 405 Preston St
- 295 S Lewis St
- 360 S Kennedy St
- 430 Preston St
- 465 Cedar St
- 450 S Rountree St
- 365 S Leroy St
- 405 S Leroy St
- 550 S Rountree St
- 822 N Lewis St
- 150 W Willow Lake Dr
- 0 Central Ave Unit 10628403
- 170 Foxridge Ct
- 160 Foxridge Ct
- 190 Foxridge Ct
- 0 Hulsey Dr
- 0 Hulsey Dr Unit 10656930