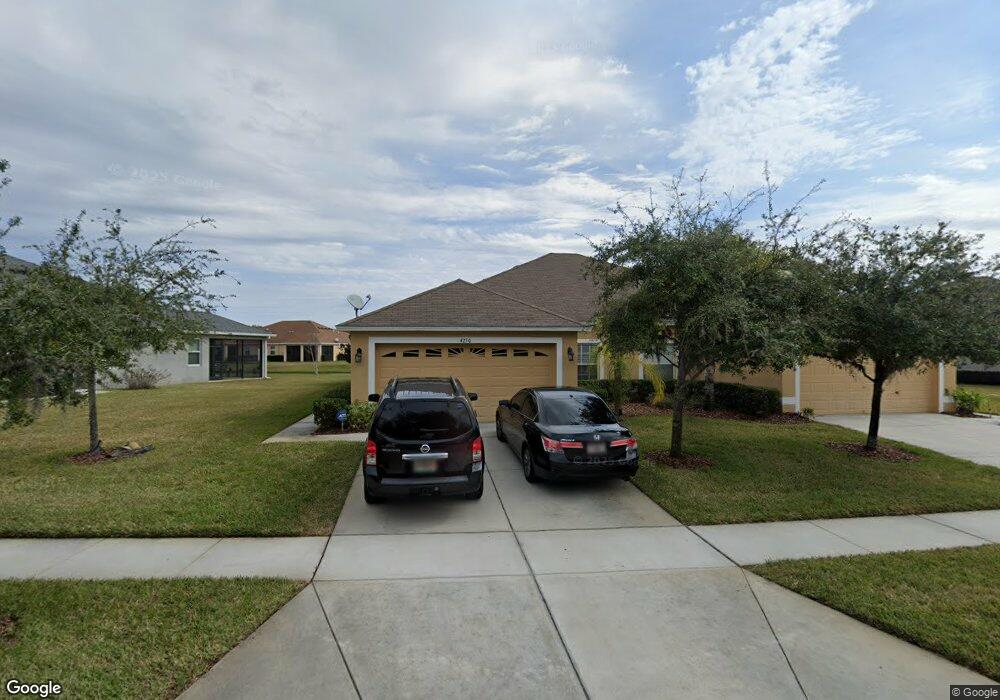
4250 Ashton Meadows Way Wesley Chapel, FL 33543
Estimated Value: $278,835 - $323,000
3
Beds
2
Baths
1,860
Sq Ft
$157/Sq Ft
Est. Value
About This Home
This home is located at 4250 Ashton Meadows Way, Wesley Chapel, FL 33543 and is currently estimated at $291,459, approximately $156 per square foot. 4250 Ashton Meadows Way is a home located in Pasco County with nearby schools including Double Branch Elementary School, Thomas E. Weightman Middle School, and Wesley Chapel High School.
Ownership History
Date
Name
Owned For
Owner Type
Purchase Details
Closed on
Aug 26, 2022
Sold by
Legros Fritzard M C
Bought by
Barlow Clara Aurora and Barlow Walter-Thomas
Current Estimated Value
Purchase Details
Closed on
Mar 25, 2014
Sold by
The Ryland Group Inc
Bought by
Romano David and Romano Kimberly A
Home Financials for this Owner
Home Financials are based on the most recent Mortgage that was taken out on this home.
Original Mortgage
$173,219
Interest Rate
4.3%
Mortgage Type
New Conventional
Purchase Details
Closed on
Sep 21, 2007
Sold by
Kimball Hill Homes Florida Inc
Bought by
Legros Fritzard M
Home Financials for this Owner
Home Financials are based on the most recent Mortgage that was taken out on this home.
Original Mortgage
$126,392
Interest Rate
6.57%
Mortgage Type
Purchase Money Mortgage
Create a Home Valuation Report for This Property
The Home Valuation Report is an in-depth analysis detailing your home's value as well as a comparison with similar homes in the area
Home Values in the Area
Average Home Value in this Area
Purchase History
| Date | Buyer | Sale Price | Title Company |
|---|---|---|---|
| Barlow Clara Aurora | $295,000 | Celebration Title Group | |
| Romano David | $192,465 | Ryland Title | |
| Legros Fritzard M | $157,990 | Enterprise Title Affiliates |
Source: Public Records
Mortgage History
| Date | Status | Borrower | Loan Amount |
|---|---|---|---|
| Previous Owner | Romano David | $173,219 | |
| Previous Owner | Legros Fritzard M | $126,392 |
Source: Public Records
Tax History Compared to Growth
Tax History
| Year | Tax Paid | Tax Assessment Tax Assessment Total Assessment is a certain percentage of the fair market value that is determined by local assessors to be the total taxable value of land and additions on the property. | Land | Improvement |
|---|---|---|---|---|
| 2025 | $1,618 | $120,540 | -- | -- |
| 2024 | $1,618 | $117,150 | -- | -- |
| 2023 | $1,551 | $113,747 | $0 | $0 |
| 2022 | $3,277 | $199,588 | $42,499 | $157,089 |
| 2021 | $2,962 | $166,990 | $31,126 | $135,864 |
| 2020 | $2,756 | $154,357 | $24,417 | $129,940 |
| 2019 | $2,645 | $146,257 | $24,417 | $121,840 |
| 2018 | $2,493 | $139,846 | $24,417 | $115,429 |
| 2017 | $2,368 | $132,981 | $24,417 | $108,564 |
| 2016 | $2,219 | $128,754 | $24,417 | $104,337 |
| 2015 | $2,143 | $126,021 | $24,417 | $101,604 |
| 2014 | $1,779 | $93,123 | $24,417 | $68,706 |
Source: Public Records
Map
Nearby Homes
- 4256 Ashton Meadows Way
- 4329 Ashton Meadows Way
- 4357 Ashton Meadows Way
- 32608 Neroli St
- 32523 Neroli St
- Crystal Plan at Valencia Ridge - Crown Collection
- Claudia Plan at Valencia Ridge - Vintage Collection
- Annabelle Plan at Valencia Ridge - Vintage Collection
- Elena Plan at Valencia Ridge - Vintage Collection
- Amethyst Plan at Valencia Ridge - Crown Collection
- Emerald Plan at Valencia Ridge - Crown Collection
- Camelia Plan at Valencia Ridge - Signature Collection
- Ibis Plan at Valencia Ridge - Signature Collection
- Jasmine Plan at Valencia Ridge - Signature Collection
- 3923 Corsica Place
- 4235 Linda Dr
- 3915 Corsica Place
- 4633 White Bay Cir
- 32249 Tribeca Ave
- 3728 Ashton Oaks Blvd
- 4242 Ashton Meadows Way
- 4300 Ashton Meadows Way
- 4236 Ashton Meadows Way
- 4306 Ashton Meadows Way
- 4251 Ashton Meadows Way
- 4228 Ashton Meadows Way
- 4243 Ashton Meadows Way
- 4255 Ashton Meadows Way
- 4259 Ashton Meadows Way
- 4239 Ashton Meadows Way
- 4310 Ashton Meadows Way
- 4301 Ashton Meadows Way
- 4235 Ashton Meadows Way
- 4243 Angelica Loop
- 4224 Ashton Meadows Way
- 4305 Ashton Meadows Way
- 4247 Angelica Loop
- 4314 Ashton Meadows Way
- 4239 Angelica Loop
- 4231 Ashton Meadows Way