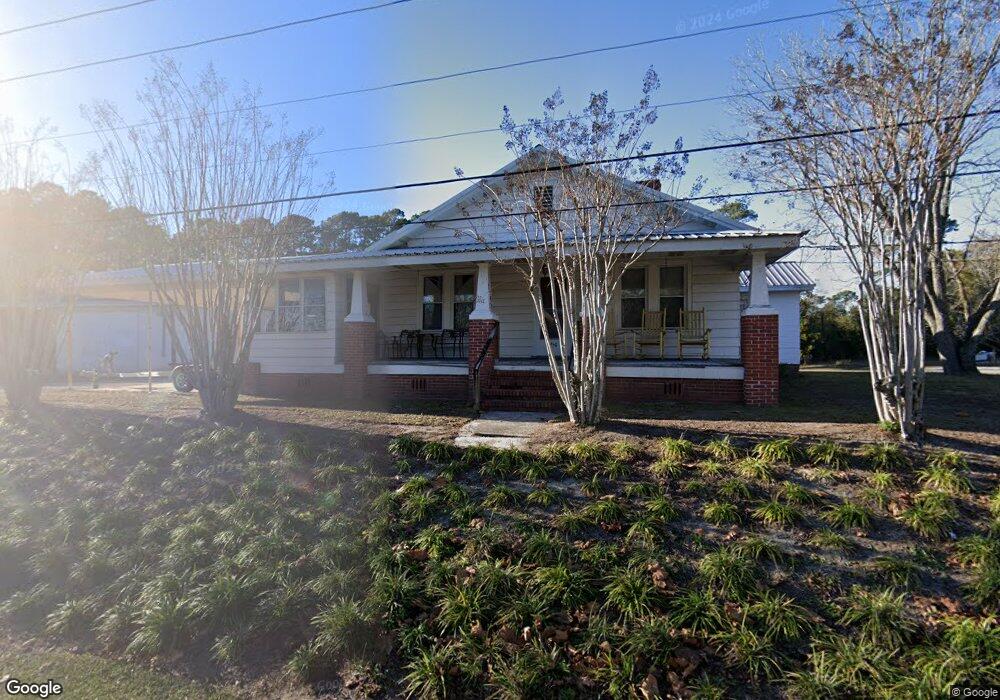
4250 Masonboro Loop Rd Wilmington, NC 28409
Lansdowne NeighborhoodEstimated Value: $397,228 - $560,000
3
Beds
2
Baths
1,412
Sq Ft
$339/Sq Ft
Est. Value
About This Home
This home is located at 4250 Masonboro Loop Rd, Wilmington, NC 28409 and is currently estimated at $478,057, approximately $338 per square foot. 4250 Masonboro Loop Rd is a home located in New Hanover County with nearby schools including Masonboro Elementary School, Myrtle Grove Middle School, and John T. Hoggard High School.
Ownership History
Date
Name
Owned For
Owner Type
Purchase Details
Closed on
Sep 8, 2015
Sold by
Hill Robert O and Hill Nina H
Bought by
Hill Two Llc
Current Estimated Value
Purchase Details
Closed on
Sep 30, 2011
Sold by
Wheeler Alton L and Wheeler Angela A
Bought by
Hill Robert O and Hill Nina H
Purchase Details
Closed on
Oct 22, 2004
Sold by
Wheeler Angela A Devisee
Bought by
Wheeler Angela A Alton T
Purchase Details
Closed on
Mar 22, 2004
Sold by
Alford Ann L
Bought by
Wheeler Angela A Executrix
Purchase Details
Closed on
Oct 29, 2001
Sold by
Alford Ann L
Bought by
Wilmington City Of
Purchase Details
Closed on
Jan 1, 2001
Bought by
Lumsden Rebecca Mrs
Purchase Details
Closed on
Apr 12, 1999
Sold by
Lumsden Mitchell S Hrs
Bought by
Alford Ann L
Purchase Details
Closed on
Feb 14, 1992
Sold by
Lumsden David W Mitchell
Bought by
Lumsden Mitchell S
Purchase Details
Closed on
Jun 1, 1981
Sold by
Lumsden Rebecca Mrs
Bought by
Lumsden David W Mitchell
Create a Home Valuation Report for This Property
The Home Valuation Report is an in-depth analysis detailing your home's value as well as a comparison with similar homes in the area
Home Values in the Area
Average Home Value in this Area
Purchase History
| Date | Buyer | Sale Price | Title Company |
|---|---|---|---|
| Hill Two Llc | -- | None Available | |
| Hill Robert O | $230,000 | None Available | |
| Wheeler Angela A Alton T | -- | -- | |
| Wheeler Angela A Executrix | -- | -- | |
| Wilmington City Of | $3,500 | -- | |
| Lumsden Rebecca Mrs | -- | -- | |
| Alford Ann L | -- | -- | |
| Lumsden Mitchell S Hrs | -- | -- | |
| Lumsden Mitchell S | -- | -- | |
| Lumsden David W Mitchell | -- | -- |
Source: Public Records
Tax History Compared to Growth
Tax History
| Year | Tax Paid | Tax Assessment Tax Assessment Total Assessment is a certain percentage of the fair market value that is determined by local assessors to be the total taxable value of land and additions on the property. | Land | Improvement |
|---|---|---|---|---|
| 2023 | $1,883 | $224,500 | $119,000 | $105,500 |
| 2022 | $1,908 | $224,500 | $119,000 | $105,500 |
| 2021 | $1,921 | $224,500 | $119,000 | $105,500 |
| 2020 | $2,099 | $199,300 | $56,800 | $142,500 |
| 2019 | $2,099 | $199,300 | $56,800 | $142,500 |
| 2018 | $0 | $199,300 | $56,800 | $142,500 |
| 2017 | $2,099 | $199,300 | $56,800 | $142,500 |
| 2016 | $2,144 | $193,500 | $73,200 | $120,300 |
| 2015 | $2,049 | $193,500 | $73,200 | $120,300 |
| 2014 | $1,962 | $193,500 | $73,200 | $120,300 |
Source: Public Records
Map
Nearby Homes
- 4204 Purviance Ct
- 4100 Purviance Ct
- 3239 Kellerton Place
- 3250 Kellerton Place
- 4315 Cranesbill Ct
- 609 Mason Knoll Ct
- 4326 Lauralis Bluff Ct
- 138 Navaho Trail
- 110 Cabbage Inlet Ln
- 4511 Masonboro Loop Rd
- 4016 Freedom Rd
- 800 Deer Haven Ct
- 300 Cabbage Inlet Ln
- 1017 Sabal Dr
- 1008 Sabal Ct
- 126 Mohawk Trail
- 5213 Shadow Branch Ln
- 610 Trails End Rd
- 3863 Daphine Ct
- 623 Barksdale Rd
- 4208 Masonboro Loop Rd
- 4200 Purviance Ct
- 4206 Purviance Ct
- 4240 Masonboro Loop Rd
- 4106 Purviance Ct
- 4256 Masonboro Loop Rd
- 4208 Purviance Ct
- 4200 Masonboro Loop Rd
- 4104 Purviance Ct
- 4201 Purviance Ct
- 4220 Masonboro Loop Rd
- 4207 Purviance Ct
- 4210 Purviance Ct
- 4234 Masonboro Loop Rd
- 4180 Masonboro Loop Rd
- 4103 Purviance Ct
- 4209 Purviance
- 4102 Purviance Ct
- 4224 Masonboro Loop Rd
- 145 Cliffside Dr