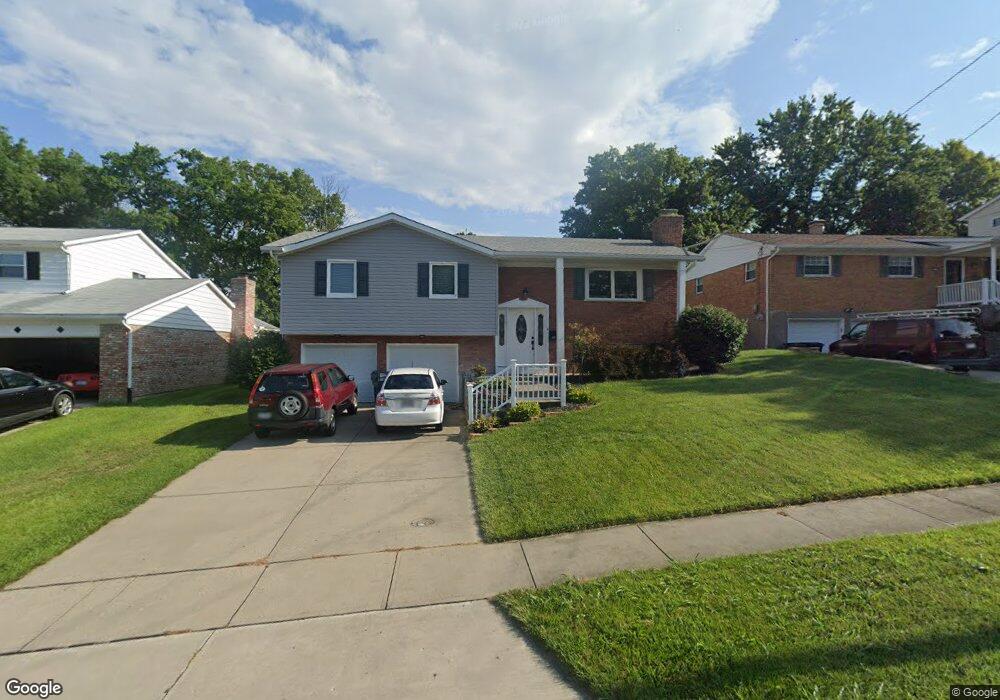
4250 Turf Ln Cincinnati, OH 45211
Estimated Value: $228,000 - $283,000
3
Beds
2
Baths
1,736
Sq Ft
$147/Sq Ft
Est. Value
About This Home
This home is located at 4250 Turf Ln, Cincinnati, OH 45211 and is currently estimated at $254,599, approximately $146 per square foot. 4250 Turf Ln is a home located in Hamilton County with nearby schools including Oakdale Elementary School, Bridgetown Middle School, and Oak Hills High School.
Ownership History
Date
Name
Owned For
Owner Type
Purchase Details
Closed on
Jul 12, 2007
Sold by
Rehkamp Randall E
Bought by
Rehkamp Michelle
Current Estimated Value
Purchase Details
Closed on
Oct 4, 2005
Sold by
Hud
Bought by
Rehkamp Randall E and Rehkamp Michelle
Home Financials for this Owner
Home Financials are based on the most recent Mortgage that was taken out on this home.
Original Mortgage
$126,552
Outstanding Balance
$68,138
Interest Rate
6.25%
Mortgage Type
Fannie Mae Freddie Mac
Estimated Equity
$186,461
Purchase Details
Closed on
Jun 8, 2005
Sold by
Hammann Christopher S and Hammann Angela M
Bought by
Hud
Purchase Details
Closed on
Mar 19, 2001
Sold by
Hammann Christopher S
Bought by
Hammann Christopher S and Hammann Angela M
Home Financials for this Owner
Home Financials are based on the most recent Mortgage that was taken out on this home.
Original Mortgage
$123,000
Interest Rate
7.02%
Mortgage Type
FHA
Create a Home Valuation Report for This Property
The Home Valuation Report is an in-depth analysis detailing your home's value as well as a comparison with similar homes in the area
Home Values in the Area
Average Home Value in this Area
Purchase History
| Date | Buyer | Sale Price | Title Company |
|---|---|---|---|
| Rehkamp Michelle | -- | Attorney | |
| Rehkamp Randall E | $126,552 | Lakeside Title & Escrow Agen | |
| Hud | $140,986 | None Available | |
| Hammann Christopher S | -- | -- | |
| Hammann Christopher S | $124,000 | -- |
Source: Public Records
Mortgage History
| Date | Status | Borrower | Loan Amount |
|---|---|---|---|
| Open | Rehkamp Randall E | $126,552 | |
| Previous Owner | Hammann Christopher S | $123,000 |
Source: Public Records
Tax History
| Year | Tax Paid | Tax Assessment Tax Assessment Total Assessment is a certain percentage of the fair market value that is determined by local assessors to be the total taxable value of land and additions on the property. | Land | Improvement |
|---|---|---|---|---|
| 2025 | $3,334 | $63,921 | $11,690 | $52,231 |
| 2024 | $3,251 | $63,921 | $11,690 | $52,231 |
| 2023 | $3,255 | $63,921 | $11,690 | $52,231 |
| 2022 | $2,937 | $48,881 | $11,382 | $37,499 |
| 2021 | $2,638 | $48,881 | $11,382 | $37,499 |
| 2020 | $2,672 | $48,881 | $11,382 | $37,499 |
| 2019 | $2,615 | $43,645 | $10,164 | $33,481 |
| 2018 | $2,619 | $43,645 | $10,164 | $33,481 |
| 2017 | $2,468 | $43,645 | $10,164 | $33,481 |
| 2016 | $2,314 | $40,832 | $10,063 | $30,769 |
| 2015 | $2,334 | $40,832 | $10,063 | $30,769 |
| 2014 | $2,337 | $40,832 | $10,063 | $30,769 |
| 2013 | $2,206 | $41,244 | $10,164 | $31,080 |
Source: Public Records
Map
Nearby Homes
- 4213 Victorian Green Dr
- 3936 Janett Ave
- 4467 Oakville Dr
- 4442 Homelawn Ave
- 4354 Oakville Dr
- 4290 Race Rd
- 3918 School Section Rd
- 4023 Washington Ave
- 3935 Carrie Ave
- 4163 Harrison Ave
- 4105 Trevor Ave
- 4104 Trevor Ave
- 3935 Lovell Ave
- 3743 Centurion Dr
- 5648 Bridgetown Rd
- 3624 Westwood Northern Blvd
- 3670 Centurion Dr
- 5696 Bridgetown Rd
- 3594 Homelawn Ave
- 3713 Frances Ave
Your Personal Tour Guide
Ask me questions while you tour the home.