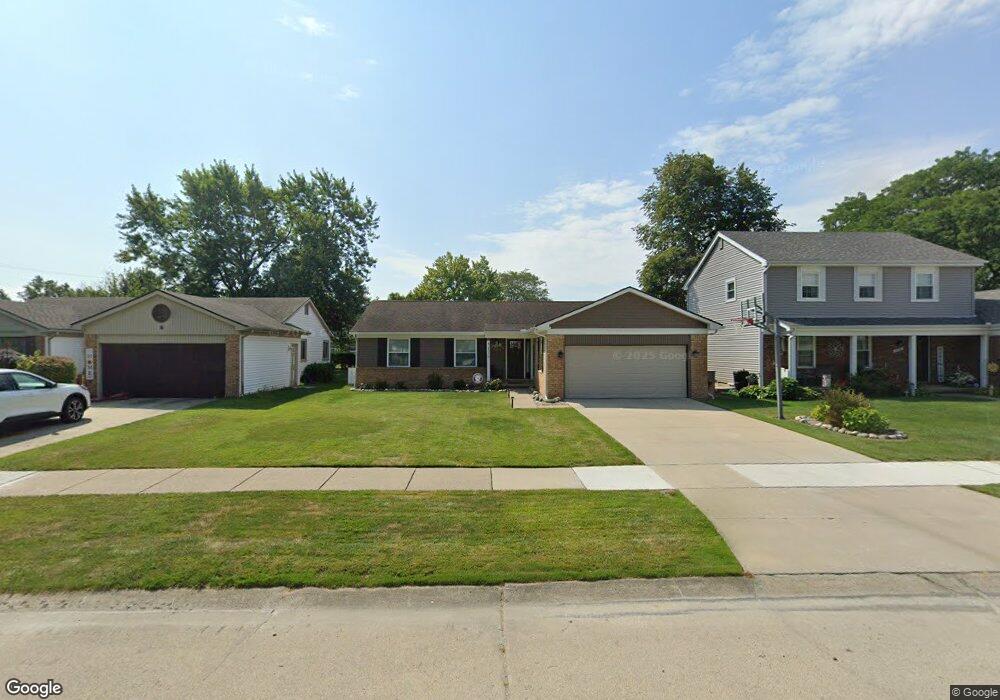
42519 Addison Ave Canton, MI 48187
Estimated Value: $338,206 - $410,000
3
Beds
1
Bath
1,500
Sq Ft
$248/Sq Ft
Est. Value
About This Home
This home is located at 42519 Addison Ave, Canton, MI 48187 and is currently estimated at $371,302, approximately $247 per square foot. 42519 Addison Ave is a home located in Wayne County with nearby schools including Canton High School, Discovery Middle School, and Salem High School.
Ownership History
Date
Name
Owned For
Owner Type
Purchase Details
Closed on
Nov 19, 2019
Sold by
Schafer Samuel G
Bought by
Schafer Samuel G and Schafer Allison A
Current Estimated Value
Purchase Details
Closed on
Sep 12, 2011
Sold by
Ross David W
Bought by
Schafer Samuel G
Home Financials for this Owner
Home Financials are based on the most recent Mortgage that was taken out on this home.
Original Mortgage
$130,603
Outstanding Balance
$88,836
Interest Rate
4.12%
Mortgage Type
FHA
Estimated Equity
$282,466
Purchase Details
Closed on
Aug 31, 2011
Sold by
Ross Michelle Louise Hamlin
Bought by
Schafer Samuel G
Home Financials for this Owner
Home Financials are based on the most recent Mortgage that was taken out on this home.
Original Mortgage
$130,603
Outstanding Balance
$88,836
Interest Rate
4.12%
Mortgage Type
FHA
Estimated Equity
$282,466
Purchase Details
Closed on
Nov 18, 2010
Sold by
Ross Brian J
Bought by
Ross David W
Purchase Details
Closed on
Aug 23, 1993
Sold by
Ross Alexander and Ross Ruth
Bought by
Ross Alexander and Ross Ruth Y
Create a Home Valuation Report for This Property
The Home Valuation Report is an in-depth analysis detailing your home's value as well as a comparison with similar homes in the area
Home Values in the Area
Average Home Value in this Area
Purchase History
| Date | Buyer | Sale Price | Title Company |
|---|---|---|---|
| Schafer Samuel G | -- | None Available | |
| Schafer Samuel G | $134,000 | Title One Inc | |
| Schafer Samuel G | -- | Title One Inc | |
| Ross David W | -- | None Available | |
| Ross Alexander | -- | None Available |
Source: Public Records
Mortgage History
| Date | Status | Borrower | Loan Amount |
|---|---|---|---|
| Open | Schafer Samuel G | $130,603 |
Source: Public Records
Tax History
| Year | Tax Paid | Tax Assessment Tax Assessment Total Assessment is a certain percentage of the fair market value that is determined by local assessors to be the total taxable value of land and additions on the property. | Land | Improvement |
|---|---|---|---|---|
| 2025 | $1,794 | $157,200 | $0 | $0 |
| 2024 | $1,743 | $154,300 | $0 | $0 |
| 2023 | $1,662 | $143,600 | $0 | $0 |
| 2022 | $3,679 | $121,000 | $0 | $0 |
| 2021 | $3,563 | $116,700 | $0 | $0 |
| 2020 | $3,515 | $116,000 | $0 | $0 |
| 2019 | $3,451 | $109,090 | $0 | $0 |
| 2018 | $1,410 | $96,380 | $0 | $0 |
| 2017 | $3,551 | $92,700 | $0 | $0 |
| 2016 | $3,140 | $97,400 | $0 | $0 |
| 2015 | $7,745 | $95,260 | $0 | $0 |
| 2013 | $7,503 | $83,010 | $0 | $0 |
| 2010 | -- | $81,350 | $36,000 | $45,350 |
Source: Public Records
Map
Nearby Homes
- 1680 Manton Blvd
- 1656 Walnut Ridge Cir
- 1399 Copeland Cir
- 41772 Glade Rd Unit 41
- 42745 Redfern St
- 42764 Lilley Pointe Dr
- 42739 Lilley Pointe Dr Unit 119
- 42714 Lilley Pointe Dr Unit 213
- 5681 Wedgewood Rd
- 42789 Lilley Pointe Dr Unit 146
- 43051 Fernwood St
- 41210 Maplewood Dr Unit 10
- 41160 Maplewood Dr Unit 15
- 41260 Maplewood Dr Unit 5
- 61673 Courtland Dr
- 61689 Courtland Dr
- 58560 Stuart Dr
- 7125 N Lilley Rd
- 1399 Elmhurst St
- 43818 Palisades Dr
- 42531 Addison Ave
- 42507 Addison Ave
- 42543 Addison Ave
- 42429 Addison Ave
- 1649 Copeland Cir
- 1661 Copeland Cir
- 1637 Copeland Cir
- 1625 Copeland Cir
- 42555 Addison Ave
- 42518 Addison Ave
- 42415 Addison Ave
- 42532 Addison Ave
- 1673 Copeland Cir
- 1615 Copeland Cir
- 42544 Addison Ave
- 42508 Keystone Ln
- 42569 Addison Ave
- 42556 Addison Ave
- 1685 Copeland Cir
- 1603 Copeland Cir