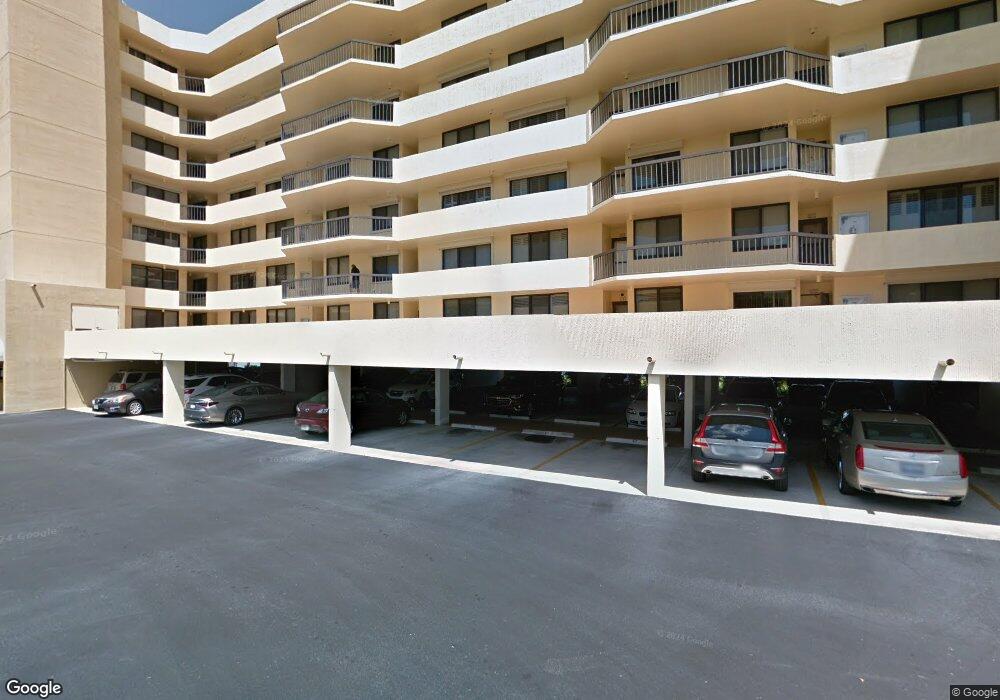
Palms of Bay Beach 4253 Bay Beach Ln Unit 4E Fort Myers Beach, FL 33931
Estimated Value: $425,530 - $519,000
2
Beds
2
Baths
1,024
Sq Ft
$454/Sq Ft
Est. Value
About This Home
This home is located at 4253 Bay Beach Ln Unit 4E, Fort Myers Beach, FL 33931 and is currently estimated at $464,633, approximately $453 per square foot. 4253 Bay Beach Ln Unit 4E is a home located in Lee County with nearby schools including Fort Myers Beach Elementary School, Bonita Springs Middle Center for the Arts, and Cypress Lake Middle School.
Ownership History
Date
Name
Owned For
Owner Type
Purchase Details
Closed on
Dec 13, 2011
Sold by
D & L Thompson Llc
Bought by
Thompson Byron L and Thompson Sheryl D
Current Estimated Value
Purchase Details
Closed on
Oct 16, 2009
Sold by
Thompson Byron L and Thompson Sheryl D
Bought by
D & L Thompson Llc
Purchase Details
Closed on
Mar 30, 2009
Sold by
Zack Carloyn H
Bought by
Thompson Byron L and Thompson Sheryl D
Home Financials for this Owner
Home Financials are based on the most recent Mortgage that was taken out on this home.
Original Mortgage
$273,750
Interest Rate
5.1%
Mortgage Type
Unknown
Purchase Details
Closed on
Nov 18, 2002
Sold by
Farrell Murray A and Farrell Janice D
Bought by
Zack Carolyn H
Home Financials for this Owner
Home Financials are based on the most recent Mortgage that was taken out on this home.
Original Mortgage
$170,000
Interest Rate
5.98%
Mortgage Type
Purchase Money Mortgage
Create a Home Valuation Report for This Property
The Home Valuation Report is an in-depth analysis detailing your home's value as well as a comparison with similar homes in the area
Home Values in the Area
Average Home Value in this Area
Purchase History
| Date | Buyer | Sale Price | Title Company |
|---|---|---|---|
| Thompson Byron L | -- | Attorney | |
| D & L Thompson Llc | -- | Attorney | |
| Thompson Byron L | $365,000 | Accent Title Insurance Agenc | |
| Zack Carolyn H | $280,000 | -- |
Source: Public Records
Mortgage History
| Date | Status | Borrower | Loan Amount |
|---|---|---|---|
| Previous Owner | Thompson Byron L | $273,750 | |
| Previous Owner | Zack Carolyn H | $170,000 |
Source: Public Records
Tax History Compared to Growth
Tax History
| Year | Tax Paid | Tax Assessment Tax Assessment Total Assessment is a certain percentage of the fair market value that is determined by local assessors to be the total taxable value of land and additions on the property. | Land | Improvement |
|---|---|---|---|---|
| 2025 | $2,814 | $256,002 | -- | -- |
| 2024 | $409 | $248,787 | -- | -- |
| 2023 | $409 | $58,655 | $0 | $58,655 |
| 2022 | $2,883 | $234,506 | $0 | $0 |
| 2021 | $2,892 | $310,858 | $0 | $310,858 |
| 2020 | $2,915 | $224,533 | $0 | $0 |
| 2019 | $2,861 | $219,485 | $0 | $0 |
| 2018 | $2,757 | $215,393 | $0 | $0 |
| 2017 | $2,751 | $210,963 | $0 | $0 |
| 2016 | $2,733 | $270,087 | $0 | $270,087 |
| 2015 | $2,761 | $255,700 | $0 | $255,700 |
| 2014 | $2,770 | $234,500 | $0 | $234,500 |
| 2013 | -- | $215,900 | $0 | $215,900 |
Source: Public Records
About Palms of Bay Beach
Map
Nearby Homes
- 4253 Bay Beach Ln Unit C3
- 4263 Bay Beach Ln Unit 714
- 4263 Bay Beach Ln Unit 713
- 4263 Bay Beach Ln Unit 413
- 4263 Bay Beach Ln Unit 111
- 4223 Bay Beach Ln Unit 4H
- 4371 Bay Beach Ln Unit 411
- 4371 Bay Beach Ln Unit 212
- 4199-14 Bay Beach Ln Unit 14
- 4361 Bay Beach Ln Unit 121
- 4265 Bay Beach Ln Unit 425
- 4265 Bay Beach Ln Unit 226
- 4265 Bay Beach Ln Unit 524
- 4265 Bay Beach Ln Unit 523
- 4203 Bay Beach Ln Unit 3E
- 4203 Bay Beach Ln Unit 3F
- 4357 Bay Beach Ln
- 4331 Bay Beach Ln Unit 353
- 4401 Bay Beach Ln Unit 833
- 4411 Bay Beach Ln Unit 744
- 4253 Bay Beach Ln Unit F4
- 4253 Bay Beach Ln Unit F3
- 4253 Bay Beach Ln Unit G2
- 4253 Bay Beach Ln Unit G1
- 4253 Bay Beach Ln Unit B-6
- 4253 Bay Beach Ln Unit D3
- 4253 Bay Beach Ln Unit F2
- 4253 Bay Beach Ln
- 4253 Bay Beach Ln Unit 4G
- 4253 Bay Beach Ln Unit 5G
- 4253 Bay Beach Ln Unit 3E
- 4253 Bay Beach Ln Unit 1C
- 4253 Bay Beach Ln Unit 4D
- 4253 Bay Beach Ln Unit 6H
- 4253 Bay Beach Ln Unit 7A
- 4253 Bay Beach Ln Unit 1F
- 4253 Bay Beach Ln Unit 6G
- 4253 Bay Beach Ln Unit 7F
- 4253 Bay Beach Ln Unit 2A
- 4253 Bay Beach Ln Unit 2D