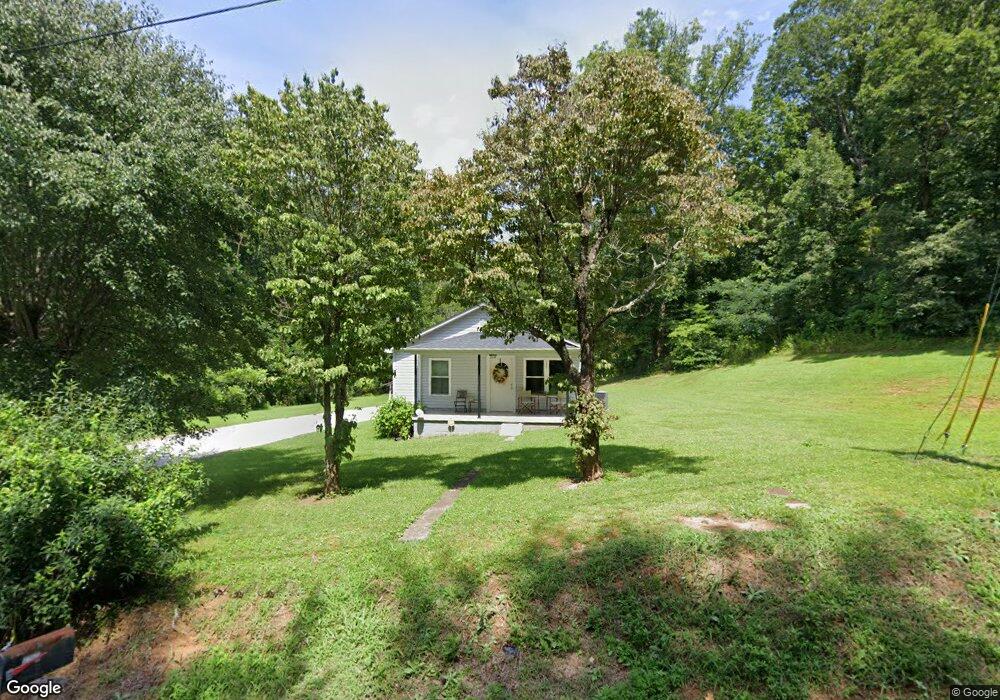
4253 Zero Mull Rd Morganton, NC 28655
Estimated Value: $123,657 - $168,000
2
Beds
1
Bath
999
Sq Ft
$146/Sq Ft
Est. Value
About This Home
This home is located at 4253 Zero Mull Rd, Morganton, NC 28655 and is currently estimated at $145,829, approximately $145 per square foot. 4253 Zero Mull Rd is a home located in Burke County with nearby schools including Mull Elementary School, Liberty Middle School, and Robert L. Patton High School.
Ownership History
Date
Name
Owned For
Owner Type
Purchase Details
Closed on
Jul 7, 2021
Sold by
Brittain William and Smith Nancy L
Bought by
Benfield Kimberly M and Benfield Rex R
Current Estimated Value
Home Financials for this Owner
Home Financials are based on the most recent Mortgage that was taken out on this home.
Original Mortgage
$72,856
Outstanding Balance
$66,106
Interest Rate
2.9%
Mortgage Type
FHA
Estimated Equity
$79,723
Purchase Details
Closed on
Nov 22, 2013
Sold by
Frost Ronnie Darrell
Bought by
Mitchell Winston B and Mitchell Connie F
Purchase Details
Closed on
Jun 24, 2011
Sold by
Mitchell Winston B and Mitchell Connie F
Bought by
Frost Ronnie Darrell
Home Financials for this Owner
Home Financials are based on the most recent Mortgage that was taken out on this home.
Original Mortgage
$35,000
Interest Rate
4.65%
Mortgage Type
Seller Take Back
Purchase Details
Closed on
Apr 1, 2011
Sold by
Condrey Joseph Walter
Bought by
Mitchell Winston B and Mitchell Connie F
Create a Home Valuation Report for This Property
The Home Valuation Report is an in-depth analysis detailing your home's value as well as a comparison with similar homes in the area
Home Values in the Area
Average Home Value in this Area
Purchase History
| Date | Buyer | Sale Price | Title Company |
|---|---|---|---|
| Benfield Kimberly M | $75,000 | None Available | |
| Mitchell Winston B | $29,000 | None Available | |
| Frost Ronnie Darrell | $45,000 | None Available | |
| Mitchell Winston B | $28,500 | None Available |
Source: Public Records
Mortgage History
| Date | Status | Borrower | Loan Amount |
|---|---|---|---|
| Open | Benfield Kimberly M | $72,856 | |
| Previous Owner | Frost Ronnie Darrell | $35,000 |
Source: Public Records
Tax History
| Year | Tax Paid | Tax Assessment Tax Assessment Total Assessment is a certain percentage of the fair market value that is determined by local assessors to be the total taxable value of land and additions on the property. | Land | Improvement |
|---|---|---|---|---|
| 2025 | $763 | $102,413 | $13,550 | $88,863 |
| 2024 | $735 | $102,413 | $13,550 | $88,863 |
| 2023 | $735 | $102,413 | $13,550 | $88,863 |
| 2022 | $518 | $54,878 | $7,713 | $47,165 |
| 2021 | $573 | $65,002 | $19,228 | $45,774 |
| 2020 | $569 | $65,002 | $19,228 | $45,774 |
| 2019 | $569 | $65,002 | $19,228 | $45,774 |
| 2018 | $542 | $61,446 | $19,228 | $42,218 |
| 2017 | $540 | $61,446 | $19,228 | $42,218 |
| 2016 | $523 | $61,446 | $19,228 | $42,218 |
| 2015 | $520 | $61,446 | $19,228 | $42,218 |
| 2014 | $510 | $60,342 | $22,428 | $37,914 |
| 2013 | $510 | $60,342 | $22,428 | $37,914 |
Source: Public Records
Map
Nearby Homes
- 3845 Laurel Heights Dr
- 3901 & 3913 High Peak Terrace Rd
- 4196 S View Blvd
- 3859 Metcalf Dr
- 2646 Mount Home Church Rd
- 2700 Dav Ave
- 3287 Stones Throw Dr Unit 3
- 4960 Singleton Dr
- 3151 Morganton Furniture Rd
- V/L Youngs Creek Rd
- 3161 Morganton Furniture Rd
- 4027 Skyline Dr
- 632 Drexel Rd
- 3791 Mountain Vista Dr Unit 26
- 3721 Mountain Vista Dr Unit 28
- 316 Drexel Rd
- 3065 Woodstream Dr
- 1438 Bethel Rd
- 2912 Woodstream Dr
- 2949 Woodwind Dr
- 4273 Zero Mull Rd
- 4289 Zero Mull Rd
- 3813 Nc 18 S
- 3799 Nc 18 S
- 4018 Winston Dr
- 3783 Nc 18 S Unit 3785
- 4305 Zero Mull Rd
- 4205 Zero Mull Rd
- 3851 N Carolina 18
- 3851 Nc 18 S
- 3769 Nc 18 S Unit 3771
- 4019 Winston Dr
- 3759 Nc 18 S
- 3759 N Carolina 18
- 3984 Winston Dr
- 3999 Winston Dr
- 3905 Nc 18 S
- 3905 N Carolina 18
- 3753 N Carolina 18
- 3753 Nc 18 S
Your Personal Tour Guide
Ask me questions while you tour the home.