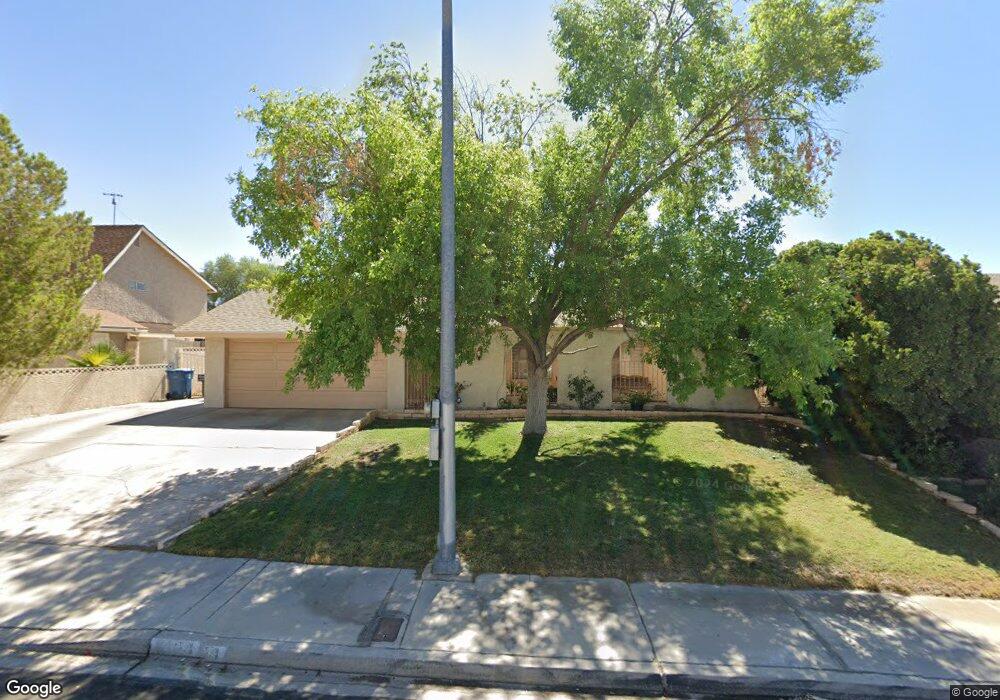
4254 El Cid Way Las Vegas, NV 89121
Paradise Valley East NeighborhoodEstimated Value: $398,496 - $459,000
4
Beds
2
Baths
1,590
Sq Ft
$275/Sq Ft
Est. Value
About This Home
This home is located at 4254 El Cid Way, Las Vegas, NV 89121 and is currently estimated at $437,124, approximately $274 per square foot. 4254 El Cid Way is a home located in Clark County with nearby schools including William E. Ferron Elementary School, C.W. Woodbury Middle School, and Chaparral High School.
Ownership History
Date
Name
Owned For
Owner Type
Purchase Details
Closed on
Feb 3, 2024
Sold by
Somrak Florence J and Somrak Richard L
Bought by
L & P Irrevocable Nevada Asset Protection Tru
Current Estimated Value
Purchase Details
Closed on
Dec 14, 2000
Sold by
Alley Barnett F and Alley Cherylyn R
Bought by
Somrak Richard M and Somrak Florence J
Home Financials for this Owner
Home Financials are based on the most recent Mortgage that was taken out on this home.
Original Mortgage
$125,600
Interest Rate
7.67%
Purchase Details
Closed on
Jun 15, 1999
Sold by
Weatherwax Wendy E
Bought by
Alley Barnett F and Alley Cherylyn R
Purchase Details
Closed on
Jun 9, 1998
Sold by
Milford Gary P and Milford Linda
Bought by
Milford Gary P
Purchase Details
Closed on
Jun 1, 1995
Sold by
Vanrhyn Joseph J and Vanrhyn Elaine A
Bought by
Weatherwax Wendy E
Home Financials for this Owner
Home Financials are based on the most recent Mortgage that was taken out on this home.
Original Mortgage
$116,750
Interest Rate
8.36%
Create a Home Valuation Report for This Property
The Home Valuation Report is an in-depth analysis detailing your home's value as well as a comparison with similar homes in the area
Home Values in the Area
Average Home Value in this Area
Purchase History
| Date | Buyer | Sale Price | Title Company |
|---|---|---|---|
| L & P Irrevocable Nevada Asset Protection Tru | -- | None Listed On Document | |
| Somrak Richard M | $157,000 | United Title | |
| Alley Barnett F | -- | United Title | |
| Milford Gary P | -- | Land Title | |
| Weatherwax Wendy E | $123,000 | United Title |
Source: Public Records
Mortgage History
| Date | Status | Borrower | Loan Amount |
|---|---|---|---|
| Previous Owner | Somrak Richard M | $125,600 | |
| Previous Owner | Weatherwax Wendy E | $116,750 |
Source: Public Records
Tax History Compared to Growth
Tax History
| Year | Tax Paid | Tax Assessment Tax Assessment Total Assessment is a certain percentage of the fair market value that is determined by local assessors to be the total taxable value of land and additions on the property. | Land | Improvement |
|---|---|---|---|---|
| 2025 | $1,022 | $62,583 | $31,150 | $31,433 |
| 2024 | $993 | $62,583 | $31,150 | $31,433 |
| 2023 | $810 | $65,021 | $36,750 | $28,271 |
| 2022 | $964 | $56,897 | $31,500 | $25,397 |
| 2021 | $936 | $50,886 | $25,900 | $24,986 |
| 2020 | $906 | $50,829 | $25,200 | $25,629 |
| 2019 | $879 | $49,125 | $23,100 | $26,025 |
| 2018 | $854 | $47,573 | $21,700 | $25,873 |
| 2017 | $1,325 | $45,191 | $18,200 | $26,991 |
| 2016 | $810 | $40,540 | $12,250 | $28,290 |
| 2015 | $807 | $38,262 | $10,500 | $27,762 |
| 2014 | $784 | $33,494 | $6,300 | $27,194 |
Source: Public Records
Map
Nearby Homes
- 4165 Santa Terrasa Place
- 4165 Grace St
- 4356 Sabadell St
- 4269 Cartegena Way
- 4278 El Campana Way
- 4274 Gibraltar St
- 4356 Powell Ave
- 4078 Gold Coast Dr
- 4072 Great Plains Way
- 4458 El Quinta Ct
- 4533 Charles Ronald Ave
- 4231 White Sands Ave
- 4625 La Fonda Dr
- 4227 White Sands Ave
- 4252 White Sands Ave
- 4606 Powell Ave
- 4259 Kona Coast Way
- 4273 Hazelcrest Dr
- 4062 Monthill Ave
- 4277 Rimcrest Rd
- 4244 El Cid Way
- 4264 El Cid Way
- 4255 Seville St
- 4265 Seville St
- 4274 El Cid Way
- 4234 El Cid Way
- 4255 El Cid Way
- 4265 El Cid Way
- 4275 Seville St
- 4235 Seville St
- 4245 El Cid Way
- 4224 El Cid Way
- 4235 El Cid Way
- 4225 Seville St
- 4225 El Cid Way
- 4445 Palencia Ave
- 4270 El Moor Way
- 4280 El Moor Way
- 4260 El Moor Way
- 4310 El Cid Cir