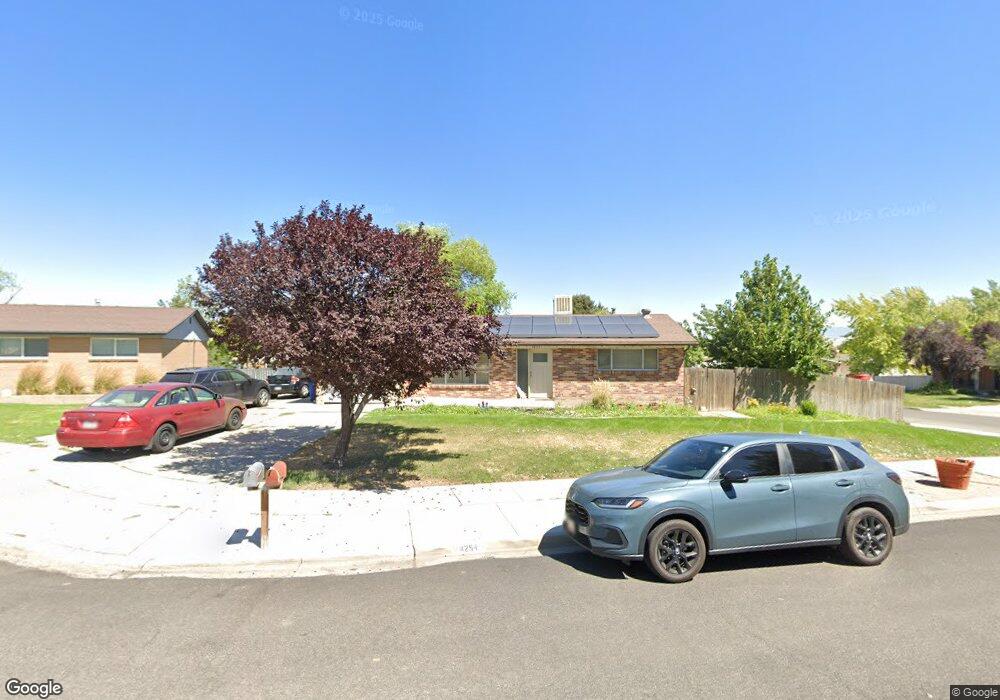
4254 W Del Cir West Valley City, UT 84120
Granger NeighborhoodEstimated Value: $451,000 - $496,000
4
Beds
2
Baths
2,072
Sq Ft
$224/Sq Ft
Est. Value
About This Home
This home is located at 4254 W Del Cir, West Valley City, UT 84120 and is currently estimated at $464,979, approximately $224 per square foot. 4254 W Del Cir is a home located in Salt Lake County with nearby schools including Philo T Farnsworth Elementary School, Valley Junior High School, and Granger High School.
Ownership History
Date
Name
Owned For
Owner Type
Purchase Details
Closed on
Mar 31, 2008
Sold by
Trujillo David A
Bought by
Duran Patricia A and Duran Teresa L
Current Estimated Value
Home Financials for this Owner
Home Financials are based on the most recent Mortgage that was taken out on this home.
Original Mortgage
$183,409
Outstanding Balance
$116,606
Interest Rate
6.04%
Mortgage Type
FHA
Estimated Equity
$348,373
Purchase Details
Closed on
Jul 7, 2005
Sold by
Faucher Mark
Bought by
Murray Scott
Home Financials for this Owner
Home Financials are based on the most recent Mortgage that was taken out on this home.
Original Mortgage
$132,000
Interest Rate
5.58%
Mortgage Type
Fannie Mae Freddie Mac
Purchase Details
Closed on
May 23, 2005
Sold by
Murray Scott
Bought by
Trujillo David A
Home Financials for this Owner
Home Financials are based on the most recent Mortgage that was taken out on this home.
Original Mortgage
$132,000
Interest Rate
5.58%
Mortgage Type
Fannie Mae Freddie Mac
Purchase Details
Closed on
Apr 6, 2005
Sold by
Bank One Na
Bought by
Faucher Mark
Home Financials for this Owner
Home Financials are based on the most recent Mortgage that was taken out on this home.
Original Mortgage
$132,000
Interest Rate
5.58%
Mortgage Type
Fannie Mae Freddie Mac
Purchase Details
Closed on
Dec 2, 2004
Sold by
Baldwin Jose T and Baldwin Tiffany E
Bought by
Bank One Na and The First National Bank Of Chicago
Purchase Details
Closed on
Dec 22, 1997
Sold by
Baldwin Jose T and Baldwin Tiffany E
Bought by
Baldwin Jose T and Baldwin Tiffany
Home Financials for this Owner
Home Financials are based on the most recent Mortgage that was taken out on this home.
Original Mortgage
$20,500
Interest Rate
7.22%
Mortgage Type
Purchase Money Mortgage
Purchase Details
Closed on
May 21, 1997
Sold by
Drury Richard E
Bought by
Baldwin Jose T and Baldwin Tiffany E
Home Financials for this Owner
Home Financials are based on the most recent Mortgage that was taken out on this home.
Original Mortgage
$79,900
Interest Rate
8.14%
Mortgage Type
Purchase Money Mortgage
Create a Home Valuation Report for This Property
The Home Valuation Report is an in-depth analysis detailing your home's value as well as a comparison with similar homes in the area
Home Values in the Area
Average Home Value in this Area
Purchase History
| Date | Buyer | Sale Price | Title Company |
|---|---|---|---|
| Duran Patricia A | -- | United Title Services | |
| Murray Scott | -- | First American Title | |
| Trujillo David A | -- | First American Title | |
| Faucher Mark | -- | First American Title | |
| Bank One Na | $149,539 | -- | |
| Baldwin Jose T | -- | -- | |
| Baldwin Jose T | -- | -- |
Source: Public Records
Mortgage History
| Date | Status | Borrower | Loan Amount |
|---|---|---|---|
| Open | Duran Patricia A | $183,409 | |
| Previous Owner | Trujillo David A | $132,000 | |
| Previous Owner | Baldwin Jose T | $20,500 | |
| Previous Owner | Baldwin Jose T | $79,900 |
Source: Public Records
Tax History Compared to Growth
Tax History
| Year | Tax Paid | Tax Assessment Tax Assessment Total Assessment is a certain percentage of the fair market value that is determined by local assessors to be the total taxable value of land and additions on the property. | Land | Improvement |
|---|---|---|---|---|
| 2025 | $2,729 | $417,200 | $96,100 | $321,100 |
| 2024 | $2,729 | $418,100 | $95,500 | $322,600 |
| 2023 | $2,572 | $377,200 | $91,900 | $285,300 |
| 2022 | $2,370 | $348,600 | $90,100 | $258,500 |
| 2021 | $2,111 | $279,100 | $69,300 | $209,800 |
| 2020 | $1,957 | $244,100 | $69,300 | $174,800 |
| 2019 | $1,970 | $237,100 | $65,300 | $171,800 |
| 2018 | $1,872 | $217,100 | $65,300 | $151,800 |
| 2017 | $1,689 | $199,200 | $65,300 | $133,900 |
| 2016 | $1,562 | $184,500 | $65,300 | $119,200 |
| 2015 | $1,521 | $171,100 | $80,800 | $90,300 |
| 2014 | $1,458 | $160,700 | $76,600 | $84,100 |
Source: Public Records
Map
Nearby Homes