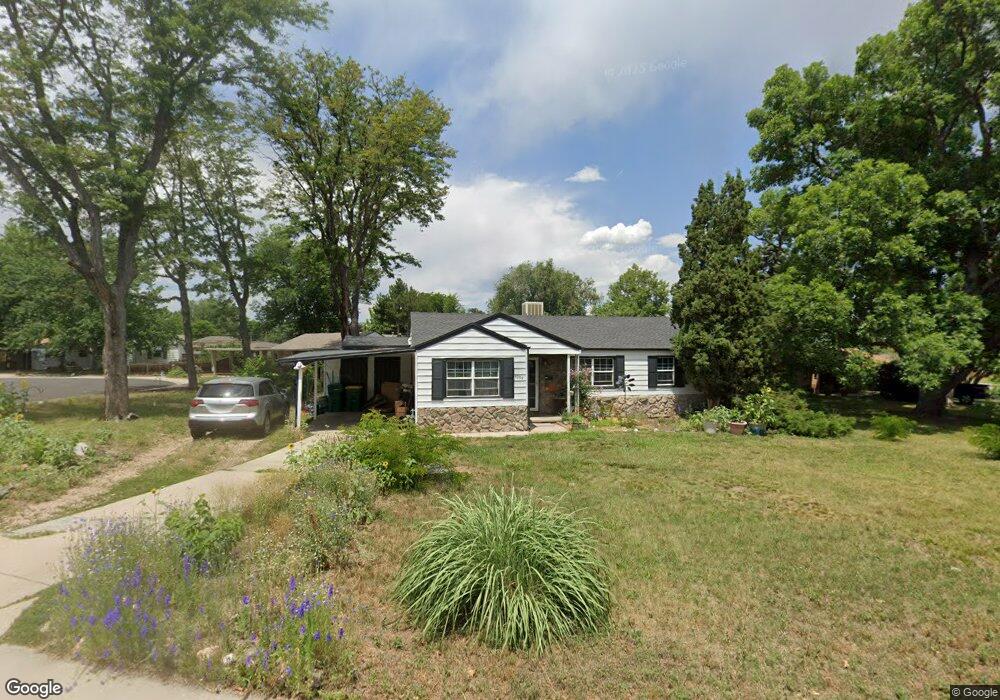
4255 Newland St Wheat Ridge, CO 80033
Barths NeighborhoodEstimated Value: $535,511 - $597,000
3
Beds
1
Bath
1,210
Sq Ft
$463/Sq Ft
Est. Value
About This Home
This home is located at 4255 Newland St, Wheat Ridge, CO 80033 and is currently estimated at $560,628, approximately $463 per square foot. 4255 Newland St is a home located in Jefferson County with nearby schools including Stevens Elementary School, Everitt Middle School, and Wheat Ridge High School.
Ownership History
Date
Name
Owned For
Owner Type
Purchase Details
Closed on
Apr 23, 2004
Sold by
Baldwin Karen L
Bought by
Lanyon Gail A
Current Estimated Value
Home Financials for this Owner
Home Financials are based on the most recent Mortgage that was taken out on this home.
Original Mortgage
$55,000
Outstanding Balance
$25,376
Interest Rate
5.38%
Mortgage Type
Purchase Money Mortgage
Estimated Equity
$535,252
Purchase Details
Closed on
Nov 15, 1996
Sold by
Carl Dalton Bradley and Maree Meg
Bought by
Baldwin Karen L
Home Financials for this Owner
Home Financials are based on the most recent Mortgage that was taken out on this home.
Original Mortgage
$101,227
Interest Rate
8.05%
Mortgage Type
FHA
Purchase Details
Closed on
Nov 24, 1993
Sold by
Gelak Edward F and Gelak Michel
Bought by
Dalton Bradley Carl and Dalton Meg Maree
Home Financials for this Owner
Home Financials are based on the most recent Mortgage that was taken out on this home.
Original Mortgage
$80,134
Interest Rate
6.83%
Mortgage Type
FHA
Create a Home Valuation Report for This Property
The Home Valuation Report is an in-depth analysis detailing your home's value as well as a comparison with similar homes in the area
Home Values in the Area
Average Home Value in this Area
Purchase History
| Date | Buyer | Sale Price | Title Company |
|---|---|---|---|
| Lanyon Gail A | $195,000 | Chicago Title Co | |
| Baldwin Karen L | $110,000 | -- | |
| Dalton Bradley Carl | $79,900 | -- |
Source: Public Records
Mortgage History
| Date | Status | Borrower | Loan Amount |
|---|---|---|---|
| Open | Lanyon Gail A | $55,000 | |
| Previous Owner | Baldwin Karen L | $101,227 | |
| Previous Owner | Dalton Bradley Carl | $80,134 |
Source: Public Records
Tax History Compared to Growth
Tax History
| Year | Tax Paid | Tax Assessment Tax Assessment Total Assessment is a certain percentage of the fair market value that is determined by local assessors to be the total taxable value of land and additions on the property. | Land | Improvement |
|---|---|---|---|---|
| 2024 | $2,315 | $33,177 | $16,258 | $16,919 |
| 2023 | $2,315 | $33,177 | $16,258 | $16,919 |
| 2022 | $1,831 | $27,514 | $16,294 | $11,220 |
| 2021 | $1,856 | $28,304 | $16,762 | $11,542 |
| 2020 | $1,630 | $25,816 | $15,817 | $9,999 |
| 2019 | $1,608 | $25,816 | $15,817 | $9,999 |
| 2018 | $1,820 | $20,422 | $9,316 | $11,106 |
| 2017 | $1,643 | $20,422 | $9,316 | $11,106 |
| 2016 | $1,522 | $17,695 | $6,280 | $11,415 |
| 2015 | $1,252 | $17,695 | $6,280 | $11,415 |
| 2014 | $1,252 | $13,659 | $5,731 | $7,928 |
Source: Public Records
Map
Nearby Homes
- 4125 Pierce St
- 4095 Quay St
- 7010 W 44th Ave
- 3830 Otis St Unit 1-4
- 3830 Pierce St
- 3820 Pierce St
- 6455 W 38th Ave
- 4295 Harlan St
- 6735 W 37th Place
- 4420 Teller St
- 4014 Upham St
- 6145 W 38th Ave
- 4541 Reed St
- 4026 Upham St
- 4008 Upham St
- 4024 Upham St
- 5926 W 41st Ave Unit 10
- 4045 Fenton Ct
- 4015 Fenton Ct
- 4020 Fenton Ct
- 4265 Newland St
- 4235 Newland St
- 4275 Newland St
- 4205 Newland St
- 4210 Newland St
- 4225 Newland St
- 4270 Newland St
- 4240 Newland St
- 4215 Newland St
- 4280 Newland St
- 4295 Newland St
- 4135 Newland St
- 4136 Newland St
- 4300 Otis St
- 4265 Marshall St
- 4310 Otis St
- 4300 Newland St
- 4285 Marshall St
- 4290 Otis St
- 4325 Newland St