4256 Griscom St Philadelphia, PA 19124
Frankford NeighborhoodEstimated Value: $205,000 - $224,647
4
Beds
1
Bath
1,700
Sq Ft
$127/Sq Ft
Est. Value
About This Home
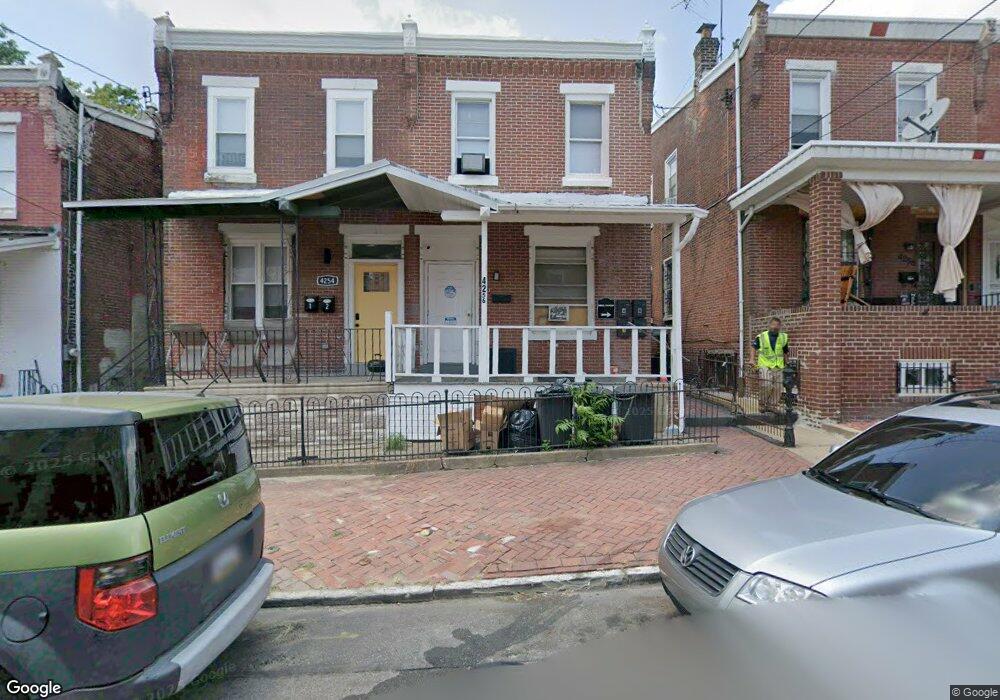
This home is located at 4256 Griscom St, Philadelphia, PA 19124 and is currently estimated at $216,216, approximately $127 per square foot. 4256 Griscom St is a home located in Philadelphia County with nearby schools including John Marshall School, Harding Warren G Middle School, and Frankford High School.
Ownership History
Date
Name
Owned For
Owner Type
Purchase Details
Closed on
Jan 5, 2018
Sold by
Fisher John R
Bought by
Mylmc Llc
Current Estimated Value
Home Financials for this Owner
Home Financials are based on the most recent Mortgage that was taken out on this home.
Original Mortgage
$95,000
Outstanding Balance
$79,982
Interest Rate
3.94%
Mortgage Type
Commercial
Estimated Equity
$136,234
Purchase Details
Closed on
Jul 18, 1986
Bought by
Fisher John R
Create a Home Valuation Report for This Property
The Home Valuation Report is an in-depth analysis detailing your home's value as well as a comparison with similar homes in the area
Home Values in the Area
Average Home Value in this Area
Purchase History
| Date | Buyer | Sale Price | Title Company |
|---|---|---|---|
| Mylmc Llc | $119,000 | Aaron Abstract Co | |
| Fisher John R | $23,800 | -- |
Source: Public Records
Mortgage History
| Date | Status | Borrower | Loan Amount |
|---|---|---|---|
| Open | Mylmc Llc | $95,000 |
Source: Public Records
Tax History Compared to Growth
Tax History
| Year | Tax Paid | Tax Assessment Tax Assessment Total Assessment is a certain percentage of the fair market value that is determined by local assessors to be the total taxable value of land and additions on the property. | Land | Improvement |
|---|---|---|---|---|
| 2026 | $2,142 | $193,800 | $38,760 | $155,040 |
| 2025 | $2,142 | $193,800 | $38,760 | $155,040 |
| 2024 | $2,142 | $193,800 | $38,760 | $155,040 |
| 2023 | $2,142 | $153,000 | $30,600 | $122,400 |
| 2022 | $1,348 | $153,000 | $30,600 | $122,400 |
| 2021 | $1,348 | $0 | $0 | $0 |
| 2020 | $1,348 | $0 | $0 | $0 |
| 2019 | $1,293 | $0 | $0 | $0 |
| 2018 | $896 | $0 | $0 | $0 |
| 2017 | $896 | $0 | $0 | $0 |
| 2016 | $1,025 | $0 | $0 | $0 |
| 2015 | $981 | $0 | $0 | $0 |
| 2014 | -- | $73,200 | $16,384 | $56,816 |
| 2012 | -- | $7,744 | $1,126 | $6,618 |
Source: Public Records
Map
Nearby Homes
- 1501 Womrath St
- 1519 Womrath St
- 4229 Griscom St
- 1507 Adams Ave
- 4229 Romain St
- 1512 Adams Ave
- 4283 Frankford Ave
- 1417 Deal St
- 1419 Deal St
- 1422 Deal St
- 4328 Leiper St
- 1319 Church St
- 4270 Paul St
- 4184 Paul St
- 4267 Paul St
- 4742 Frankford Ave
- 1417 Unity St
- 4405 Frankford Ave
- 1603 E Hunting Park Ave
- 4147 Paul St