Estimated Value: $477,000 - $533,273
4
Beds
2
Baths
1,518
Sq Ft
$336/Sq Ft
Est. Value
About This Home
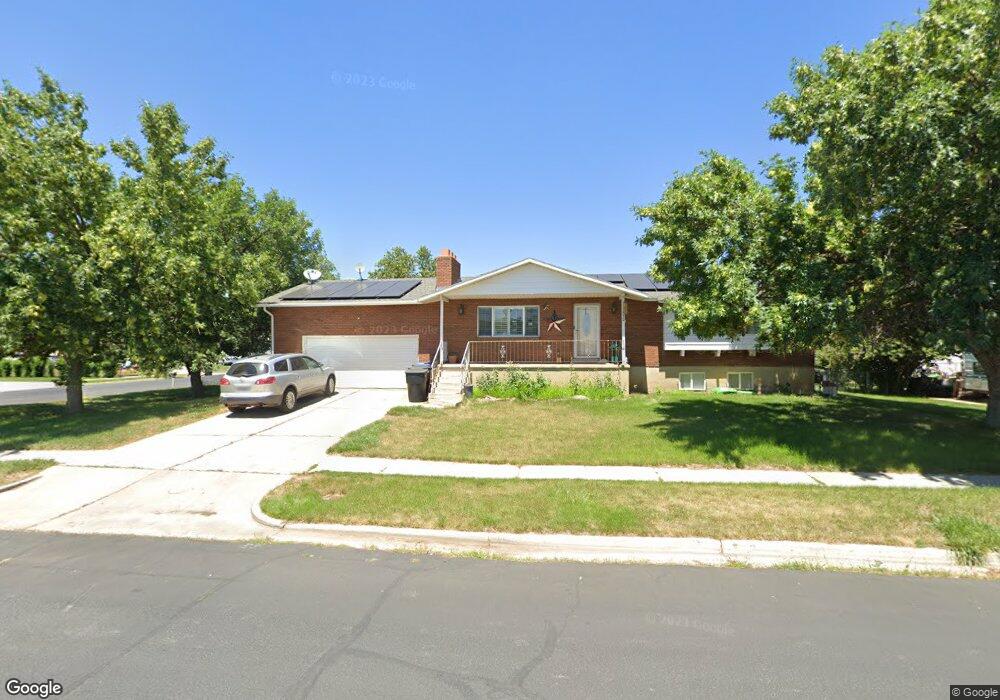
This home is located at 4256 W 2475 N, Ogden, UT 84404 and is currently estimated at $509,318, approximately $335 per square foot. 4256 W 2475 N is a home located in Weber County with nearby schools including Plain City School, Wahlquist Junior High School, and Fremont High School.
Ownership History
Date
Name
Owned For
Owner Type
Purchase Details
Closed on
Dec 7, 2020
Sold by
Sagel Don D and Sagel Denise E
Bought by
Sagel Dee and Sagel Denise E
Current Estimated Value
Home Financials for this Owner
Home Financials are based on the most recent Mortgage that was taken out on this home.
Original Mortgage
$11,947
Outstanding Balance
$10,147
Interest Rate
2.8%
Mortgage Type
FHA
Estimated Equity
$499,171
Purchase Details
Closed on
Mar 13, 2008
Sold by
Farrell Brothers Construction Inc
Bought by
Petersen D Wade
Home Financials for this Owner
Home Financials are based on the most recent Mortgage that was taken out on this home.
Original Mortgage
$255,983
Outstanding Balance
$158,702
Interest Rate
5.65%
Mortgage Type
FHA
Estimated Equity
$350,616
Purchase Details
Closed on
Nov 30, 2006
Sold by
Moyes Lewis G and Lewis G & Beverly J Moyes Trus
Bought by
Farrell Brothers Construction Inc
Create a Home Valuation Report for This Property
The Home Valuation Report is an in-depth analysis detailing your home's value as well as a comparison with similar homes in the area
Home Values in the Area
Average Home Value in this Area
Purchase History
| Date | Buyer | Sale Price | Title Company |
|---|---|---|---|
| Sagel Dee | -- | None Available | |
| Petersen D Wade | -- | Bonneville Superior Title Co | |
| Farrell Brothers Construction Inc | -- | U S Title Of Utah Ogden |
Source: Public Records
Mortgage History
| Date | Status | Borrower | Loan Amount |
|---|---|---|---|
| Open | Sagel Dee | $11,947 | |
| Open | Petersen D Wade | $255,983 |
Source: Public Records
Tax History Compared to Growth
Tax History
| Year | Tax Paid | Tax Assessment Tax Assessment Total Assessment is a certain percentage of the fair market value that is determined by local assessors to be the total taxable value of land and additions on the property. | Land | Improvement |
|---|---|---|---|---|
| 2025 | $2,793 | $498,366 | $155,574 | $342,792 |
| 2024 | $2,669 | $269,499 | $85,562 | $183,937 |
| 2023 | $2,667 | $270,600 | $77,352 | $193,248 |
| 2022 | $2,675 | $278,850 | $74,530 | $204,320 |
| 2021 | $2,282 | $396,000 | $65,422 | $330,578 |
| 2020 | $2,224 | $356,000 | $55,341 | $300,659 |
| 2019 | $2,132 | $321,000 | $50,236 | $270,764 |
| 2018 | $2,068 | $297,000 | $50,236 | $246,764 |
| 2017 | $1,845 | $248,000 | $44,181 | $203,819 |
| 2016 | $1,785 | $131,232 | $22,075 | $109,157 |
| 2015 | $1,529 | $106,710 | $22,075 | $84,635 |
| 2014 | $1,428 | $96,760 | $23,164 | $73,596 |
Source: Public Records
Map
Nearby Homes
- 2416 N 4275 W
- 2700 N 4200 W
- 2793 W 2775 N
- 2797 W 2775 N Unit 129
- 2782 W 2775 N Unit 105
- 2792 W 2775 N Unit 103
- 2787 W 2775 N Unit 127
- 3966 W 2200 N
- 3963 2800 North St
- 4188 W 2875 N
- 3622 W 2200 St N Unit 23
- 4210 W 1975 N
- 2131 N 4650 W
- 2255 N 3600 St W Unit 21
- 2233 N 3600 St W Unit 22
- 1885 N 4475 W
- 3594 W 2200 N Unit 3
- 4212 W 1975 N
- 1748 N 4100 St W
- 3462 W 2565 N