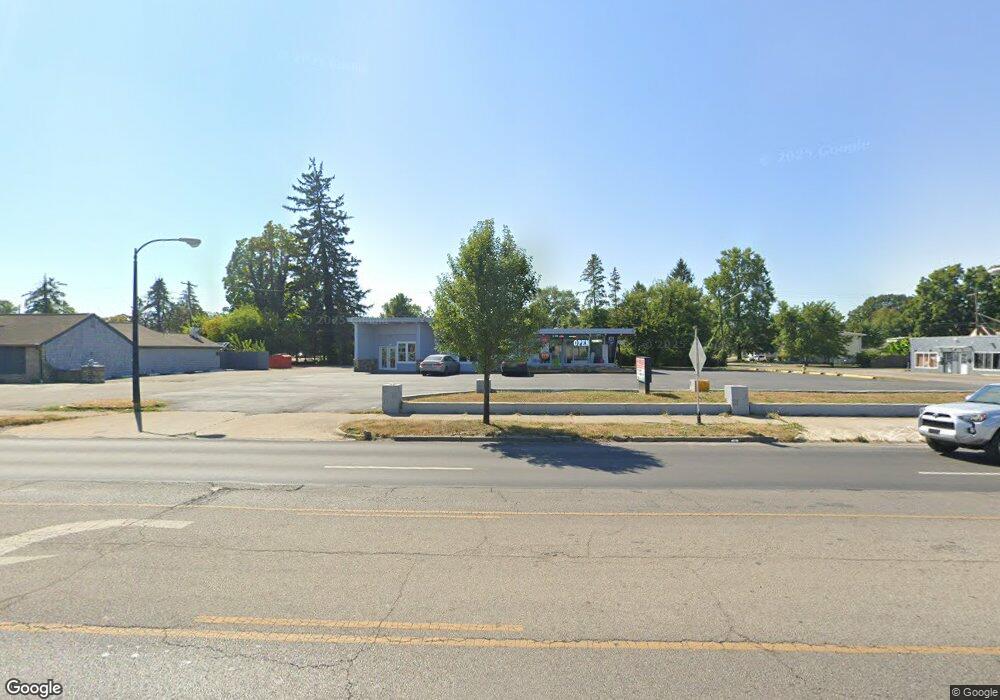
4257 E Main St Columbus, OH 43213
Estimated Value: $324,332
Studio
--
Bath
1,944
Sq Ft
$167/Sq Ft
Est. Value
About This Home
This home is located at 4257 E Main St, Columbus, OH 43213 and is currently estimated at $324,332, approximately $166 per square foot. 4257 E Main St is a home located in Franklin County with nearby schools including Etna Road Elementary School, Beechwood Elementary School, and Rosemore Middle School.
Ownership History
Date
Name
Owned For
Owner Type
Purchase Details
Closed on
Jul 30, 2024
Sold by
Xact Hd Restoration Llc
Bought by
Bs 3D Real Estate Holdings Llc
Current Estimated Value
Purchase Details
Closed on
Apr 17, 2024
Sold by
Xact Hd Restoration Llc
Bought by
Bs 3D Real Estate Holdings Llc
Purchase Details
Closed on
Mar 15, 2023
Sold by
Hernandez Mora Leonel
Bought by
Xact Hd Restoration Llc
Purchase Details
Closed on
May 21, 2020
Sold by
4257 E Main St Lc
Bought by
Mora Leonel Hernandez
Purchase Details
Closed on
Oct 31, 2018
Sold by
Express Main Street Inc
Bought by
4257 E Main St Llc
Purchase Details
Closed on
Dec 30, 2005
Sold by
Certified Oil Corp
Bought by
Certified Real Estate Inc
Purchase Details
Closed on
Jul 31, 1979
Bought by
Certified Petroleum Co
Create a Home Valuation Report for This Property
The Home Valuation Report is an in-depth analysis detailing your home's value as well as a comparison with similar homes in the area
Home Values in the Area
Average Home Value in this Area
Purchase History
| Date | Buyer | Sale Price | Title Company |
|---|---|---|---|
| Bs 3D Real Estate Holdings Llc | $330,000 | Ohio Real Title | |
| Bs 3D Real Estate Holdings Llc | $335,000 | Ohio Real Title | |
| Xact Hd Restoration Llc | -- | Equity Settlement Services | |
| Mora Leonel Hernandez | $220,000 | Crown Trident Title Agency | |
| 4257 E Main St Llc | $180,000 | Talon Title Agency Llc | |
| Certified Real Estate Inc | -- | Attorney | |
| Certified Petroleum Co | $71,300 | -- |
Source: Public Records
Tax History
| Year | Tax Paid | Tax Assessment Tax Assessment Total Assessment is a certain percentage of the fair market value that is determined by local assessors to be the total taxable value of land and additions on the property. | Land | Improvement |
|---|---|---|---|---|
| 2025 | $10,713 | $90,600 | $69,170 | $21,430 |
| 2024 | $10,713 | $90,600 | $69,170 | $21,430 |
| 2023 | $7,641 | $90,600 | $69,170 | $21,430 |
| 2022 | $16,713 | $61,610 | $38,050 | $23,560 |
| 2021 | $5,296 | $61,610 | $38,050 | $23,560 |
| 2020 | $4,771 | $61,610 | $38,050 | $23,560 |
| 2019 | $4,561 | $56,010 | $34,580 | $21,430 |
| 2018 | $5,052 | $56,010 | $34,580 | $21,430 |
| 2017 | $4,449 | $56,010 | $34,580 | $21,430 |
| 2016 | $6,097 | $61,260 | $34,580 | $26,680 |
| 2015 | $5,116 | $61,260 | $34,580 | $26,680 |
| 2014 | $5,117 | $61,260 | $34,580 | $26,680 |
| 2013 | $2,226 | $53,795 | $34,580 | $19,215 |
Source: Public Records
Map
Nearby Homes
- 963 Erickson Ave
- 957 Rose Place
- 798 S Yearling Rd
- 4174 Wright Park
- 745 Pierce Ave
- 1085 S Hamilton Rd
- 695 Erickson Ave
- 3955 E Fulton St
- 3990 Astor Ave
- 1275 Elaine Rd
- 1301 Bernhard Rd
- 706 Ross Rd
- 1001 Beechwood Rd
- 1281 Maetzel Dr
- 1035 E Fulton St
- 4024 Colby Ave
- 1265 Elderwood Ave
- 1356 Harlow Rd
- 931 E Fulton St
- 1229 Simpson Dr
- 4263 E Main St
- 943 Erickson Ave
- 944 Elaine Rd
- 949 Erickson Ave
- 957 Erickson Ave
- 960 Elaine Rd
- 4244 E Main St
- 4275 E Main St
- 941 Elaine Rd
- 4252 E Main St
- 940 Erickson Ave
- 4279 E Main St
- 952 Erickson Ave
- 966 Elaine Rd
- 4203 E Main St
- 4285 E Main St
- 958 Erickson Ave
- 951 Elaine Rd
- 880 Elaine Rd
- 970 Erickson Ave
Your Personal Tour Guide
Ask me questions while you tour the home.