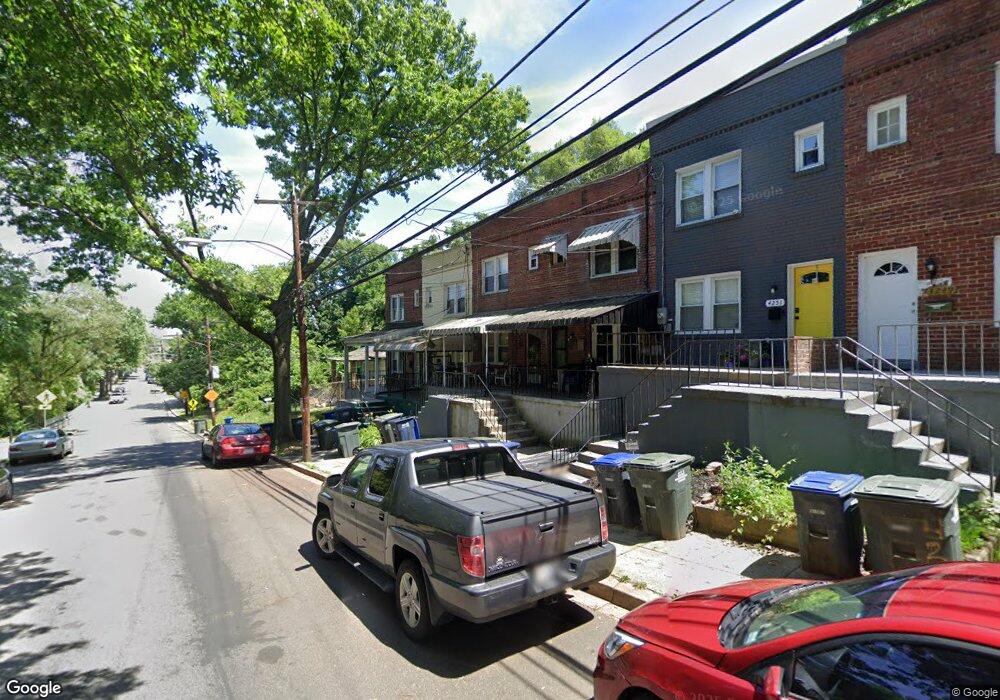
4257 Gault Place NE Washington, DC 20019
Mahaning Heights NeighborhoodEstimated Value: $280,304 - $326,000
2
Beds
2
Baths
810
Sq Ft
$380/Sq Ft
Est. Value
About This Home
This home is located at 4257 Gault Place NE, Washington, DC 20019 and is currently estimated at $307,826, approximately $380 per square foot. 4257 Gault Place NE is a home located in District of Columbia with nearby schools including Aiton Elementary School, Kelly Miller Middle School, and H.D. Woodson High School.
Ownership History
Date
Name
Owned For
Owner Type
Purchase Details
Closed on
Dec 16, 2011
Sold by
Sliwka Paul J
Bought by
Alston Clarence
Current Estimated Value
Purchase Details
Closed on
Jun 24, 2010
Sold by
Federal National Mortgage Association
Bought by
Sliwka Paul J
Purchase Details
Closed on
Jan 19, 2010
Sold by
Clarke Sub Tr James E and Dyson Sub Tr Renee
Bought by
Federal National Mortgage Association
Purchase Details
Closed on
Jun 12, 2007
Sold by
Hockaday-Bey George
Bought by
Spencer Gabriel
Home Financials for this Owner
Home Financials are based on the most recent Mortgage that was taken out on this home.
Original Mortgage
$180,000
Interest Rate
6.48%
Mortgage Type
New Conventional
Purchase Details
Closed on
Jul 1, 2006
Sold by
Bost Brenda
Bought by
Aryiin Samirah
Create a Home Valuation Report for This Property
The Home Valuation Report is an in-depth analysis detailing your home's value as well as a comparison with similar homes in the area
Home Values in the Area
Average Home Value in this Area
Purchase History
| Date | Buyer | Sale Price | Title Company |
|---|---|---|---|
| Alston Clarence | $139,900 | -- | |
| Sliwka Paul J | $70,000 | -- | |
| Federal National Mortgage Association | $197,349 | -- | |
| Spencer Gabriel | $180,000 | -- | |
| Aryiin Samirah | $118,180 | -- |
Source: Public Records
Mortgage History
| Date | Status | Borrower | Loan Amount |
|---|---|---|---|
| Previous Owner | Spencer Gabriel | $180,000 |
Source: Public Records
Tax History Compared to Growth
Tax History
| Year | Tax Paid | Tax Assessment Tax Assessment Total Assessment is a certain percentage of the fair market value that is determined by local assessors to be the total taxable value of land and additions on the property. | Land | Improvement |
|---|---|---|---|---|
| 2025 | $734 | $283,700 | $130,030 | $153,670 |
| 2024 | $731 | $279,380 | $126,760 | $152,620 |
| 2023 | $729 | $268,980 | $122,450 | $146,530 |
| 2022 | $1,475 | $252,220 | $122,230 | $129,990 |
| 2021 | $1,404 | $241,500 | $120,430 | $121,070 |
| 2020 | $1,295 | $231,650 | $116,810 | $114,840 |
| 2019 | $1,820 | $214,170 | $113,460 | $100,710 |
| 2018 | $1,681 | $197,800 | $0 | $0 |
| 2017 | $1,548 | $182,170 | $0 | $0 |
| 2016 | $1,511 | $177,750 | $0 | $0 |
| 2015 | $1,318 | $155,070 | $0 | $0 |
| 2014 | $1,241 | $145,970 | $0 | $0 |
Source: Public Records
Map
Nearby Homes
- 4227 Gault Place NE
- 4225 Gault Place NE
- 4202 Grant St NE Unit 301
- 4333 Hayes St NE
- 4226 Foote St NE
- 4131 Hunt Place NE
- 4401 Hayes St NE
- 612 44th St NE
- 4108 Grant St NE
- 0 44th St NE
- 4106 Gault Place NE Unit 5
- 4230 Edson Place NE
- 4234 Edson Place NE Unit 3
- 527 42nd St NE
- 4029 Gault Place NE
- 4228 Eads St NE
- 4419 Foote St NE
- 4035 Grant St NE
- 4433 Hunt Place NE
- 4007 Gault Place NE
- 4255 Gault Place NE
- 4259 Gault Place NE
- 4253 Gault Place NE
- 4251 Gault Place NE
- 4271 Gault Place NE
- 4249 Gault Place NE
- 4216 Grant St NE
- 4224 Grant St NE
- 4226 Grant St NE
- 4228 Grant St NE
- 4214 Grant St NE
- 4232 Grant St NE
- 4234 Grant St NE
- 4212 Grant St NE
- 4238 Gault Place NE
- 4236 Grant St NE
- 4236 Gault Place NE
- 4234 Gault Place NE
- 4240 Grant St NE
- 4232 Gault Place NE