Estimated Value: $376,000 - $399,000
4
Beds
2
Baths
1,920
Sq Ft
$203/Sq Ft
Est. Value
About This Home
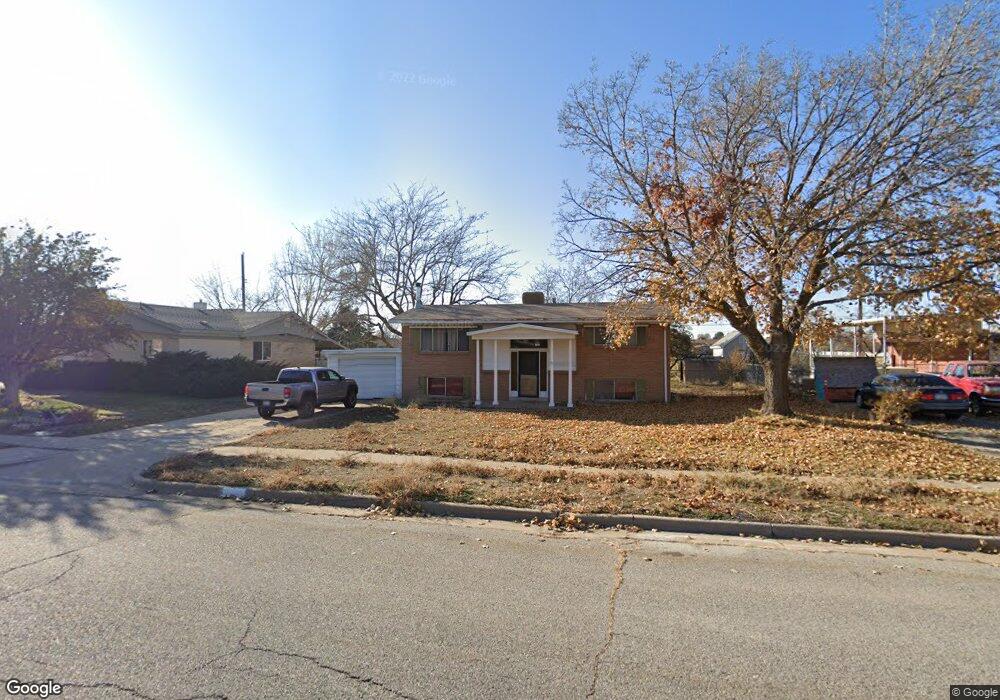
This home is located at 4257 S 2075 W, Roy, UT 84067 and is currently estimated at $390,179, approximately $203 per square foot. 4257 S 2075 W is a home located in Weber County with nearby schools including North Park School, Sand Ridge Junior High School, and Roy High School.
Ownership History
Date
Name
Owned For
Owner Type
Purchase Details
Closed on
Jul 26, 2021
Sold by
Odell Jayden K
Bought by
Odell Jayden Kim and Odell Megan
Current Estimated Value
Home Financials for this Owner
Home Financials are based on the most recent Mortgage that was taken out on this home.
Original Mortgage
$139,000
Outstanding Balance
$122,640
Interest Rate
2.93%
Mortgage Type
New Conventional
Estimated Equity
$267,539
Purchase Details
Closed on
Feb 11, 2015
Sold by
Greenwell Cody M
Bought by
Dell Jayden K O
Purchase Details
Closed on
Apr 18, 2012
Sold by
Saunders Earl G and Saunders Marie B
Bought by
Greenwell Cody M
Home Financials for this Owner
Home Financials are based on the most recent Mortgage that was taken out on this home.
Original Mortgage
$89,083
Interest Rate
3.87%
Mortgage Type
FHA
Create a Home Valuation Report for This Property
The Home Valuation Report is an in-depth analysis detailing your home's value as well as a comparison with similar homes in the area
Home Values in the Area
Average Home Value in this Area
Purchase History
| Date | Buyer | Sale Price | Title Company |
|---|---|---|---|
| Odell Jayden Kim | -- | Us Title Insurance Agency | |
| Dell Jayden K O | -- | Bay National Title Co | |
| Greenwell Cody M | -- | Mountain View Title |
Source: Public Records
Mortgage History
| Date | Status | Borrower | Loan Amount |
|---|---|---|---|
| Open | Odell Jayden Kim | $139,000 | |
| Previous Owner | Greenwell Cody M | $89,083 |
Source: Public Records
Tax History Compared to Growth
Tax History
| Year | Tax Paid | Tax Assessment Tax Assessment Total Assessment is a certain percentage of the fair market value that is determined by local assessors to be the total taxable value of land and additions on the property. | Land | Improvement |
|---|---|---|---|---|
| 2025 | $2,328 | $363,846 | $123,559 | $240,287 |
| 2024 | $2,274 | $196,899 | $67,965 | $128,934 |
| 2023 | $2,178 | $188,650 | $62,578 | $126,072 |
| 2022 | $2,142 | $190,850 | $54,616 | $136,234 |
| 2021 | $1,695 | $246,000 | $69,380 | $176,620 |
| 2020 | $1,591 | $212,000 | $69,380 | $142,620 |
| 2019 | $1,645 | $208,000 | $40,048 | $167,952 |
| 2018 | $1,537 | $182,000 | $37,028 | $144,972 |
| 2017 | $1,495 | $166,113 | $37,028 | $129,085 |
| 2016 | $1,348 | $79,636 | $17,771 | $61,865 |
| 2015 | $1,205 | $72,165 | $17,771 | $54,394 |
| 2014 | $1,210 | $71,839 | $17,771 | $54,068 |
Source: Public Records
Map
Nearby Homes
- 4220 S 2075 W
- 2015 W 4225 S
- 4205 S 2075 W
- 4328 S 2175 W
- 2082 W 4450 S
- 2263 W 4400 S
- 4073 S 2175 W
- 4475 S 1975 W
- 4110 S 2275 W
- 2070 W 4000 S
- 2050 W 4000 S
- 4164 S 2400 W
- 1825 W 4400 S
- 1959 3985 St S Unit 2
- 2096 W 3950 S
- 2259 W 4525 S
- 3965 S 2225 W
- 4536 S 1900 W Unit 12
- 2038 W 4600 S
- 3923 S 1975 W Unit 15