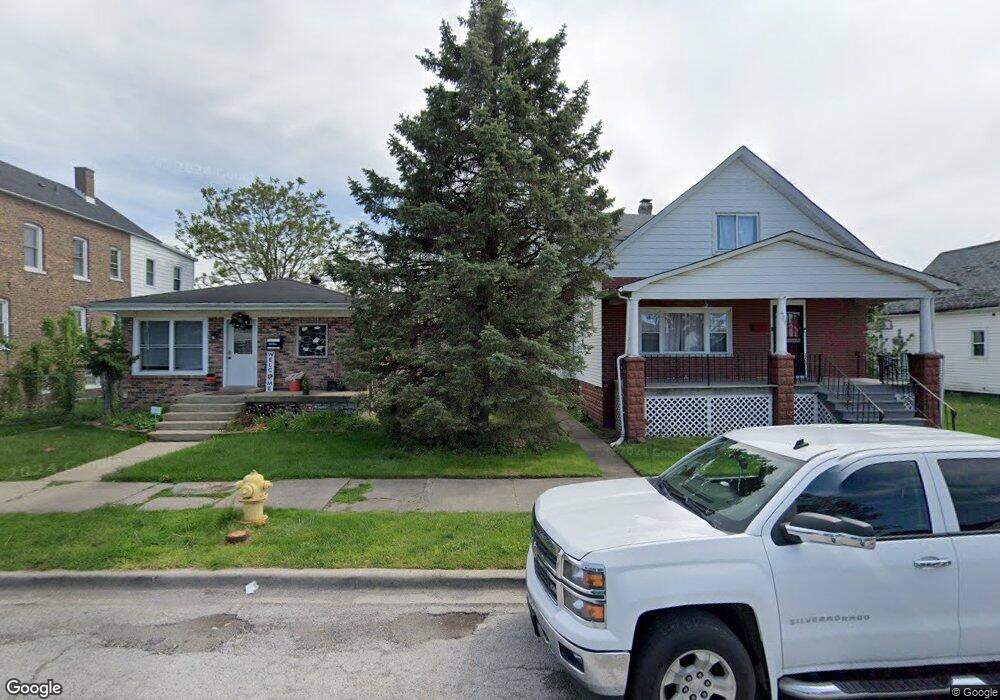
426 155th Place Calumet City, IL 60409
Estimated Value: $126,000 - $208,000
3
Beds
2
Baths
1,354
Sq Ft
$118/Sq Ft
Est. Value
About This Home
This home is located at 426 155th Place, Calumet City, IL 60409 and is currently estimated at $160,165, approximately $118 per square foot. 426 155th Place is a home located in Cook County with nearby schools including Lincoln Elementary School, Thornton Fractional North High School, and Hammond Academy Of Science & Tech.
Ownership History
Date
Name
Owned For
Owner Type
Purchase Details
Closed on
Mar 24, 2009
Sold by
Deutsche Bank National Trust Company
Bought by
Arambula Jose David A Perez
Current Estimated Value
Purchase Details
Closed on
Dec 17, 2008
Sold by
Barney Hilda J and Barney Frederick
Bought by
Deutsche Bank National Trust Company
Purchase Details
Closed on
Nov 5, 2004
Sold by
Gutierrez Herman and Gutierrez Vivianna
Bought by
Barney Hilda J
Home Financials for this Owner
Home Financials are based on the most recent Mortgage that was taken out on this home.
Original Mortgage
$93,600
Interest Rate
7%
Mortgage Type
Unknown
Purchase Details
Closed on
Jan 8, 1999
Sold by
Weiss Donald E and Weiss Pamela
Bought by
Gutierrez Herman and Gutierrez Viviana
Home Financials for this Owner
Home Financials are based on the most recent Mortgage that was taken out on this home.
Original Mortgage
$75,000
Interest Rate
7.17%
Create a Home Valuation Report for This Property
The Home Valuation Report is an in-depth analysis detailing your home's value as well as a comparison with similar homes in the area
Home Values in the Area
Average Home Value in this Area
Purchase History
| Date | Buyer | Sale Price | Title Company |
|---|---|---|---|
| Arambula Jose David A Perez | $18,000 | St | |
| Deutsche Bank National Trust Company | -- | None Available | |
| Barney Hilda J | $117,500 | Ticor Title Insurance Compan | |
| Gutierrez Herman | $79,000 | -- |
Source: Public Records
Mortgage History
| Date | Status | Borrower | Loan Amount |
|---|---|---|---|
| Previous Owner | Barney Hilda J | $93,600 | |
| Previous Owner | Gutierrez Herman | $75,000 | |
| Closed | Barney Hilda J | $23,412 |
Source: Public Records
Tax History Compared to Growth
Tax History
| Year | Tax Paid | Tax Assessment Tax Assessment Total Assessment is a certain percentage of the fair market value that is determined by local assessors to be the total taxable value of land and additions on the property. | Land | Improvement |
|---|---|---|---|---|
| 2024 | $2,406 | $7,665 | $1,240 | $6,425 |
| 2023 | $2,052 | $7,665 | $1,240 | $6,425 |
| 2022 | $2,052 | $6,255 | $1,085 | $5,170 |
| 2021 | $2,161 | $6,255 | $1,085 | $5,170 |
| 2020 | $2,172 | $6,255 | $1,085 | $5,170 |
| 2019 | $1,238 | $5,141 | $1,007 | $4,134 |
| 2018 | $1,215 | $5,141 | $1,007 | $4,134 |
| 2017 | $1,212 | $5,141 | $1,007 | $4,134 |
| 2016 | $1,757 | $5,214 | $930 | $4,284 |
| 2015 | $1,617 | $5,214 | $930 | $4,284 |
| 2014 | $1,650 | $5,214 | $930 | $4,284 |
| 2013 | $1,826 | $5,854 | $930 | $4,924 |
Source: Public Records
Map
Nearby Homes
- 420 155th Place
- 428 155th Place
- 430 155th Place
- 432 155th Place
- 414 155th Place
- 414 155th Place
- 434 155th Place
- 423 155th St
- 427 155th St
- 438 155th Place
- 417 155th St
- 417 155th St Unit SUITE-C
- 429 155th St
- 419 155th St
- 431 155th St
- 427 155th Place
- 412 155th Place
- 425 155th Place
- 421 155th Place
- 444 155th Place