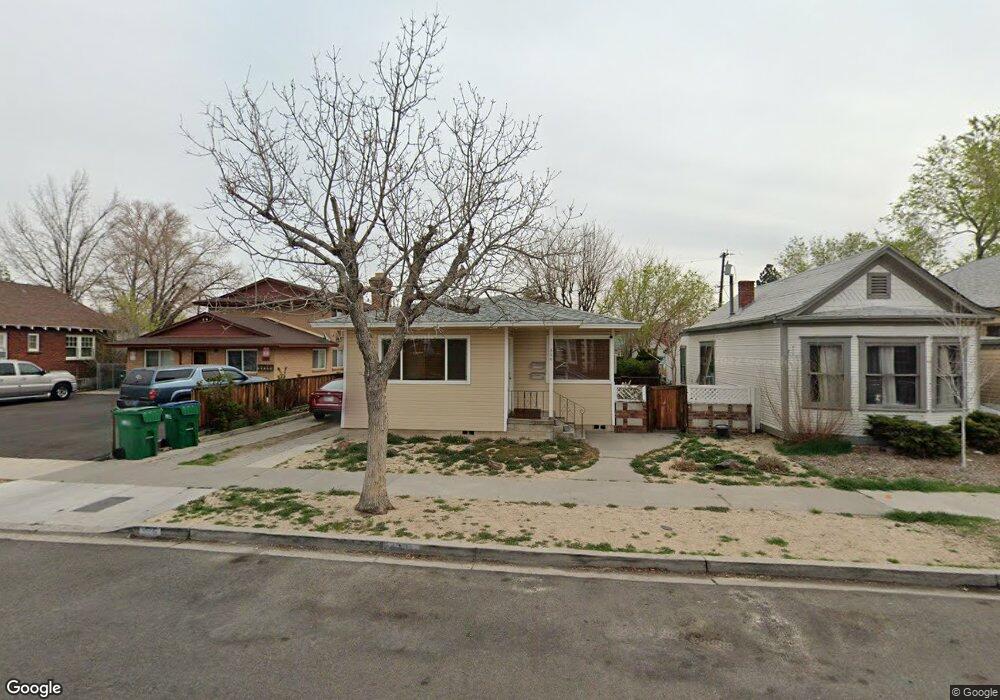
426 9th St Sparks, NV 89431
Downtown Sparks NeighborhoodEstimated Value: $436,886 - $508,000
4
Beds
2
Baths
1,988
Sq Ft
$244/Sq Ft
Est. Value
About This Home
This home is located at 426 9th St, Sparks, NV 89431 and is currently estimated at $485,722, approximately $244 per square foot. 426 9th St is a home located in Washoe County with nearby schools including Robert Mitchell Elementary School, Sparks Middle School, and Sparks High School.
Ownership History
Date
Name
Owned For
Owner Type
Purchase Details
Closed on
Jan 9, 2007
Sold by
Parigini Rick B
Bought by
Parigini Rick B and The Rick B Parigini 2007 Revocable Trust
Current Estimated Value
Purchase Details
Closed on
Oct 30, 1997
Sold by
Paragini Diane E and Hull Diane E
Bought by
Parigini Rick B
Home Financials for this Owner
Home Financials are based on the most recent Mortgage that was taken out on this home.
Original Mortgage
$40,000
Interest Rate
7.36%
Create a Home Valuation Report for This Property
The Home Valuation Report is an in-depth analysis detailing your home's value as well as a comparison with similar homes in the area
Home Values in the Area
Average Home Value in this Area
Purchase History
| Date | Buyer | Sale Price | Title Company |
|---|---|---|---|
| Parigini Rick B | -- | None Available | |
| Parigini Rick B | -- | Stewart Title |
Source: Public Records
Mortgage History
| Date | Status | Borrower | Loan Amount |
|---|---|---|---|
| Closed | Parigini Rick B | $40,000 |
Source: Public Records
Tax History
| Year | Tax Paid | Tax Assessment Tax Assessment Total Assessment is a certain percentage of the fair market value that is determined by local assessors to be the total taxable value of land and additions on the property. | Land | Improvement |
|---|---|---|---|---|
| 2026 | $1,267 | $70,878 | $40,880 | $29,999 |
| 2024 | $1,203 | $67,306 | $38,710 | $28,596 |
| 2023 | $1,168 | $65,821 | $39,305 | $26,516 |
| 2022 | $1,134 | $54,423 | $32,865 | $21,558 |
| 2021 | $1,102 | $46,432 | $25,375 | $21,057 |
| 2020 | $1,035 | $46,921 | $26,250 | $20,671 |
| 2019 | $986 | $42,015 | $22,470 | $19,545 |
| 2018 | $941 | $33,921 | $15,190 | $18,731 |
| 2017 | $904 | $32,380 | $14,000 | $18,380 |
| 2016 | $883 | $29,642 | $11,200 | $18,442 |
| 2015 | $883 | $26,080 | $8,050 | $18,030 |
| 2014 | $856 | $24,005 | $7,000 | $17,005 |
| 2013 | -- | $22,750 | $6,160 | $16,590 |
Source: Public Records
Map
Nearby Homes
Your Personal Tour Guide
Ask me questions while you tour the home.