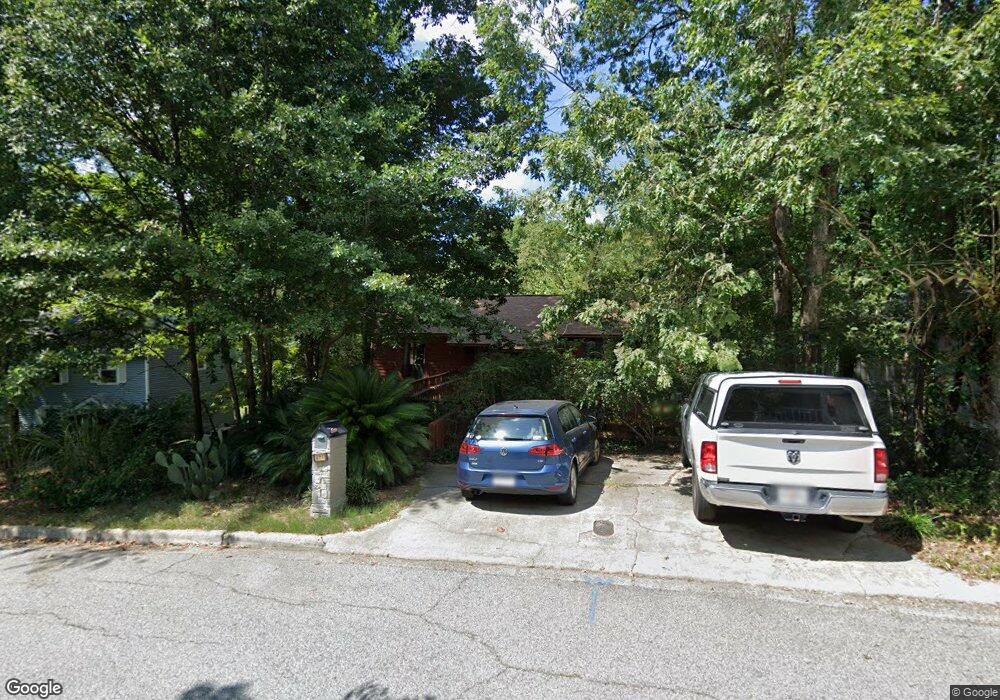
426 Bristol Rd Augusta, GA 30907
Estimated Value: $262,582 - $277,000
3
Beds
3
Baths
2,215
Sq Ft
$121/Sq Ft
Est. Value
About This Home
This home is located at 426 Bristol Rd, Augusta, GA 30907 and is currently estimated at $268,896, approximately $121 per square foot. 426 Bristol Rd is a home located in Columbia County with nearby schools including Blue Ridge Elementary School, Lakeside Middle School, and Lakeside High School.
Ownership History
Date
Name
Owned For
Owner Type
Purchase Details
Closed on
May 16, 2011
Sold by
Robbins Kenneth L
Bought by
Harris William David
Current Estimated Value
Home Financials for this Owner
Home Financials are based on the most recent Mortgage that was taken out on this home.
Original Mortgage
$123,025
Outstanding Balance
$7,236
Interest Rate
4.14%
Mortgage Type
VA
Estimated Equity
$261,660
Purchase Details
Closed on
Jul 31, 2002
Sold by
Hartzman Virginia Luter
Bought by
Robbins Kenneth L
Home Financials for this Owner
Home Financials are based on the most recent Mortgage that was taken out on this home.
Original Mortgage
$87,452
Interest Rate
6.62%
Mortgage Type
FHA
Purchase Details
Closed on
Apr 17, 2002
Sold by
Deadmon Alfreda Small
Bought by
Hartzman Virginia Luter and Davis Virginia Luter
Create a Home Valuation Report for This Property
The Home Valuation Report is an in-depth analysis detailing your home's value as well as a comparison with similar homes in the area
Home Values in the Area
Average Home Value in this Area
Purchase History
| Date | Buyer | Sale Price | Title Company |
|---|---|---|---|
| Harris William David | $129,500 | -- | |
| Harris William David | $129,500 | -- | |
| Robbins Kenneth L | $107,700 | -- | |
| Hartzman Virginia Luter | $3,000 | -- |
Source: Public Records
Mortgage History
| Date | Status | Borrower | Loan Amount |
|---|---|---|---|
| Open | Harris William David | $123,025 | |
| Closed | Harris William David | $123,025 | |
| Previous Owner | Robbins Kenneth L | $87,452 |
Source: Public Records
Tax History
| Year | Tax Paid | Tax Assessment Tax Assessment Total Assessment is a certain percentage of the fair market value that is determined by local assessors to be the total taxable value of land and additions on the property. | Land | Improvement |
|---|---|---|---|---|
| 2025 | $60 | $103,097 | $14,074 | $89,023 |
| 2024 | $60 | $102,541 | $16,654 | $85,887 |
| 2023 | $1,853 | $90,051 | $15,548 | $74,503 |
| 2022 | $2,318 | $88,902 | $12,968 | $75,934 |
| 2021 | $2,053 | $75,286 | $11,770 | $63,516 |
| 2020 | $1,899 | $68,214 | $11,032 | $57,182 |
| 2019 | $1,696 | $60,909 | $9,190 | $51,719 |
| 2018 | $1,717 | $61,418 | $10,203 | $51,215 |
| 2017 | $1,612 | $57,464 | $9,374 | $48,090 |
| 2016 | $1,689 | $60,480 | $9,166 | $51,314 |
| 2015 | $1,675 | $59,847 | $9,166 | $50,681 |
| 2014 | $1,617 | $56,960 | $8,981 | $47,979 |
Source: Public Records
Map
Nearby Homes
- 427 Bristol Rd
- 455 Bristol Rd
- 4176 Arlington Rd
- 417 Blue Ridge Dr
- 340 Lamplighter Ln
- 4209 Fairfield Cir
- 452 Windtree Place
- 0 Commons Dr
- 432 Old Evans Rd
- 4061 Briarwood Dr
- 3991 High Chaparral Dr
- 386 Connor Cir
- 375 Connor Cir
- 3779 Winchester Trail
- 4019 Danielle Dr
- 634 Kemper Dr
- 0 Mccormick Rd Unit 547611
- 309 Candlewood Dr
- 4126 Dunes Dr
- 407 Old Evans Rd
- 428 Bristol Rd
- 424 Bristol Rd
- 430 Bristol Rd
- 422 Bristol Rd
- 419 Bristol Rd
- 432 Bristol Rd
- 417 Bristol Rd
- 420 Bristol Rd
- 423 Bristol Rd
- 434 Bristol Rd
- 415 Bristol Rd
- 425 Bristol Rd
- 504 Fairfield Ct
- 502 Fairfield Ct
- 4091 Amherst Ct
- 4093 Amherst Ct
- 418 Bristol Rd
- 4154 Arlington Rd
- 4152 Arlington Rd
- 436 Bristol Rd
Your Personal Tour Guide
Ask me questions while you tour the home.