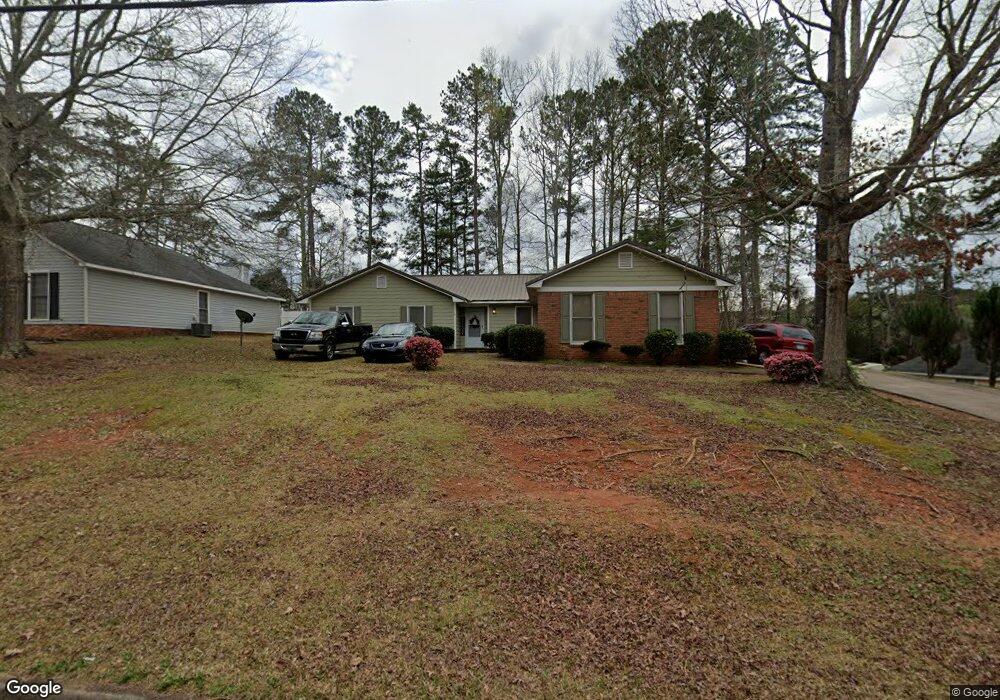
426 Brookstone Dr Lagrange, GA 30241
Estimated Value: $221,738 - $233,000
3
Beds
2
Baths
1,666
Sq Ft
$137/Sq Ft
Est. Value
About This Home
This home is located at 426 Brookstone Dr, Lagrange, GA 30241 and is currently estimated at $228,185, approximately $136 per square foot. 426 Brookstone Dr is a home located in Troup County with nearby schools including Callaway Elementary School, Hogansville Elementary School, and Callaway Middle School.
Ownership History
Date
Name
Owned For
Owner Type
Purchase Details
Closed on
May 29, 2007
Sold by
Hixon Sharon
Bought by
Aspinwall James R
Current Estimated Value
Purchase Details
Closed on
Mar 30, 2004
Sold by
Benjamin T Leath
Bought by
Rary Sharon D and Rary Ligon
Purchase Details
Closed on
Jun 5, 2001
Sold by
William Keyes Harrison
Bought by
Benjamin T Leath
Purchase Details
Closed on
Sep 21, 1995
Sold by
Daigle and Schutza
Bought by
William Keyes Harrison
Purchase Details
Closed on
May 26, 1993
Sold by
Kevin Jean Daigle
Bought by
Daigle and Schutza
Purchase Details
Closed on
Aug 10, 1990
Sold by
Smith Turner L and Smith Kathryn P
Bought by
Kevin Jean Daigle
Purchase Details
Closed on
Jul 29, 1988
Sold by
J B Mize Contractors
Bought by
Smith Turner L and Smith Kathryn P
Purchase Details
Closed on
Jan 1, 1987
Sold by
Century Properties
Bought by
J B Mize Contractors
Purchase Details
Closed on
Oct 1, 1986
Create a Home Valuation Report for This Property
The Home Valuation Report is an in-depth analysis detailing your home's value as well as a comparison with similar homes in the area
Purchase History
We collect this data history from publicly available records. To have your information removed, we recommend requesting removal directly through your county’s website.
| Date | Buyer | Sale Price | Title Company |
|---|---|---|---|
| Aspinwall James R | $108,000 | -- | |
| Rary Sharon D | $118,000 | -- | |
| Benjamin T Leath | $99,900 | -- | |
| William Keyes Harrison | $76,000 | -- | |
| Daigle | -- | -- | |
| Kevin Jean Daigle | $70,000 | -- | |
| Smith Turner L | $79,500 | -- | |
| J B Mize Contractors | -- | -- | |
| Century Properties | -- | -- | |
| -- | -- | -- |
Source: Public Records
Tax History
| Year | Tax Paid | Tax Assessment Tax Assessment Total Assessment is a certain percentage of the fair market value that is determined by local assessors to be the total taxable value of land and additions on the property. | Land | Improvement |
|---|---|---|---|---|
| 2025 | $2,524 | $92,560 | $14,000 | $78,560 |
| 2024 | $1,228 | $75,760 | $14,000 | $61,760 |
| 2023 | $2,087 | $76,520 | $14,000 | $62,520 |
| 2022 | $1,794 | $64,280 | $10,000 | $54,280 |
| 2021 | $1,612 | $53,440 | $8,000 | $45,440 |
| 2020 | $1,612 | $53,440 | $8,000 | $45,440 |
| 2019 | $1,404 | $46,560 | $8,000 | $38,560 |
| 2018 | $1,169 | $38,760 | $6,000 | $32,760 |
| 2017 | $1,169 | $38,760 | $6,000 | $32,760 |
| 2016 | $1,171 | $38,830 | $6,000 | $32,830 |
| 2015 | $1,173 | $38,830 | $6,000 | $32,830 |
| 2014 | $1,123 | $37,102 | $6,000 | $31,102 |
| 2013 | -- | $37,108 | $6,000 | $31,108 |
Source: Public Records
Map
Nearby Homes
- 438 Brookstone Dr
- 106 Ridgefield Cir
- 110 Northwoods Dr
- 124 Woodridge Cir
- 203 N Cary St
- 101 Sarah Ln
- 210 Old Pond Rd
- 610 Youngs Mill Rd
- 304 Bridgette Blvd
- 202 N Barnard Ave
- 102 Peachtree Ct
- 107 N Barnard Ave
- 304 Lenox Cir
- 119 Sir Lancelot St
- 0 N Barnard Ave
- 112 Celebration Blvd
- 129 Celebration Blvd
- 7 Gulfstream Dr
- 8 Gulfstream Dr
- 212 Cleveland Dr
- 324 Brookstone Dr
- 428 Brookstone Dr
- 215 Baileys Way
- 215 Baileys Way Unit LOT 69
- 217 Baileys Way
- 213 Baileys Way
- 213 Baileys Way Unit LOT 70
- 219 Baileys Way Unit 67
- 322 Brookstone Dr
- 221 Baileys Way
- 302 Brookfield Dr
- 430 Brookstone Dr
- 301 Brookfield Dr
- 211 Baileys Way
- 427 Brookstone Dr
- 223 Baileys Way
- 0 Baileys Point Unit 7320307
- 303 Brookfield Dr
- 320 Brookstone Dr
- 225 Baileys Way
Your Personal Tour Guide
Ask me questions while you tour the home.