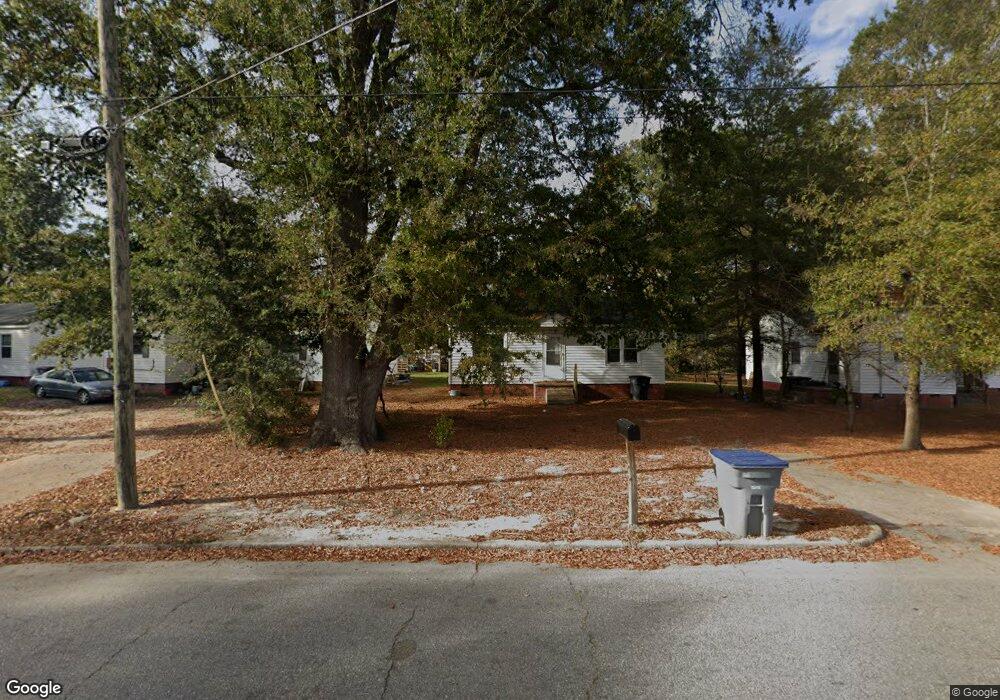
426 Craig St Rocky Mount, NC 27803
Estimated Value: $64,333 - $205,000
2
Beds
1
Bath
924
Sq Ft
$120/Sq Ft
Est. Value
About This Home
This home is located at 426 Craig St, Rocky Mount, NC 27803 and is currently estimated at $110,833, approximately $119 per square foot. 426 Craig St is a home located in Nash County with nearby schools including Williford Elementary School, Rocky Mount Middle School, and Rocky Mount High School.
Ownership History
Date
Name
Owned For
Owner Type
Purchase Details
Closed on
May 21, 2025
Sold by
Sonoma Lane Llc
Bought by
Promenade Nc Llc
Current Estimated Value
Home Financials for this Owner
Home Financials are based on the most recent Mortgage that was taken out on this home.
Original Mortgage
$1,119,500
Outstanding Balance
$1,115,657
Interest Rate
6.81%
Mortgage Type
New Conventional
Estimated Equity
-$1,004,824
Purchase Details
Closed on
May 13, 2021
Sold by
Blue Holdings Rmt Llc
Bought by
South Dogwood Partners Llc
Purchase Details
Closed on
Jan 26, 2021
Sold by
Taj Llc
Bought by
Blue Holdings Rmt Llc
Home Financials for this Owner
Home Financials are based on the most recent Mortgage that was taken out on this home.
Original Mortgage
$9,500
Interest Rate
2.6%
Mortgage Type
Commercial
Purchase Details
Closed on
Jan 15, 2004
Bought by
T A J Llc
Create a Home Valuation Report for This Property
The Home Valuation Report is an in-depth analysis detailing your home's value as well as a comparison with similar homes in the area
Home Values in the Area
Average Home Value in this Area
Purchase History
| Date | Buyer | Sale Price | Title Company |
|---|---|---|---|
| Promenade Nc Llc | -- | None Listed On Document | |
| South Dogwood Partners Llc | $128,000 | None Available | |
| Blue Holdings Rmt Llc | $152,000 | None Available | |
| T A J Llc | $14,500 | -- |
Source: Public Records
Mortgage History
| Date | Status | Borrower | Loan Amount |
|---|---|---|---|
| Open | Promenade Nc Llc | $1,119,500 | |
| Previous Owner | Blue Holdings Rmt Llc | $9,500 |
Source: Public Records
Tax History Compared to Growth
Tax History
| Year | Tax Paid | Tax Assessment Tax Assessment Total Assessment is a certain percentage of the fair market value that is determined by local assessors to be the total taxable value of land and additions on the property. | Land | Improvement |
|---|---|---|---|---|
| 2024 | $211 | $16,180 | $7,350 | $8,830 |
| 2023 | $108 | $16,180 | $0 | $0 |
| 2022 | $111 | $16,180 | $7,350 | $8,830 |
| 2021 | $108 | $16,180 | $7,350 | $8,830 |
| 2020 | $108 | $16,180 | $7,350 | $8,830 |
| 2019 | $108 | $16,180 | $7,350 | $8,830 |
| 2018 | $108 | $16,180 | $0 | $0 |
| 2017 | $108 | $16,180 | $0 | $0 |
| 2015 | $217 | $32,360 | $0 | $0 |
| 2014 | $217 | $32,360 | $0 | $0 |
Source: Public Records
Map
Nearby Homes
- 404 Estell St
- 1337 Maple St
- 415 Estell St
- 2004 S Church St
- 509 Mullins St
- 625 Cascade Ave
- 640 Beamon St
- 414 Dexter St
- 324 Kingston Ave
- 1286 W Raleigh Blvd
- 816 Nashville Rd
- 638 Cleveland St
- 1106 S Franklin St
- 602 Dexter St
- 517 Henry St
- 311 Henry St
- 1025 S Franklin St
- 528 Canary Dr
- 923 Belvedere St
- 3921 Arlington St