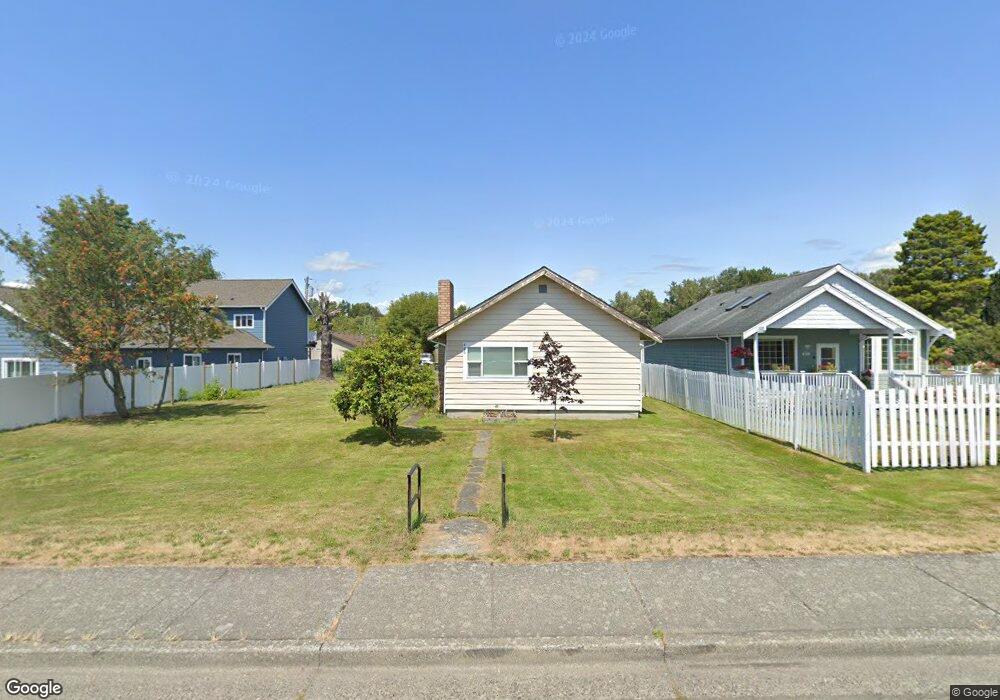
426 D St Blaine, WA 98230
Estimated Value: $384,000 - $437,000
2
Beds
1
Bath
1,104
Sq Ft
$376/Sq Ft
Est. Value
About This Home
This home is located at 426 D St, Blaine, WA 98230 and is currently estimated at $414,688, approximately $375 per square foot. 426 D St is a home located in Whatcom County with nearby schools including Blaine Primary School, Blaine Elementary School, and Blaine Middle School.
Ownership History
Date
Name
Owned For
Owner Type
Purchase Details
Closed on
May 20, 2019
Sold by
Gibson Angelo
Bought by
Terry Doris
Current Estimated Value
Home Financials for this Owner
Home Financials are based on the most recent Mortgage that was taken out on this home.
Original Mortgage
$215,000
Outstanding Balance
$188,645
Interest Rate
4.1%
Mortgage Type
New Conventional
Estimated Equity
$226,043
Purchase Details
Closed on
Jan 12, 2005
Sold by
Dutton Larry A and Dutton Sandy J
Bought by
Gibson Mike and Gibson Kimberley
Create a Home Valuation Report for This Property
The Home Valuation Report is an in-depth analysis detailing your home's value as well as a comparison with similar homes in the area
Home Values in the Area
Average Home Value in this Area
Purchase History
| Date | Buyer | Sale Price | Title Company |
|---|---|---|---|
| Terry Doris | $235,000 | Whatcom Land Title | |
| Gibson Mike | $143,500 | Stewart Title Company |
Source: Public Records
Mortgage History
| Date | Status | Borrower | Loan Amount |
|---|---|---|---|
| Open | Terry Doris | $215,000 |
Source: Public Records
Tax History Compared to Growth
Tax History
| Year | Tax Paid | Tax Assessment Tax Assessment Total Assessment is a certain percentage of the fair market value that is determined by local assessors to be the total taxable value of land and additions on the property. | Land | Improvement |
|---|---|---|---|---|
| 2024 | $2,248 | $333,619 | $138,750 | $194,869 |
| 2023 | $2,248 | $333,619 | $138,750 | $194,869 |
| 2022 | $1,802 | $300,558 | $125,000 | $175,558 |
| 2021 | $1,718 | $206,428 | $107,341 | $99,087 |
| 2020 | $1,635 | $179,503 | $93,340 | $86,163 |
| 2019 | $1,523 | $164,378 | $85,475 | $78,903 |
| 2018 | $1,415 | $149,377 | $77,675 | $71,702 |
| 2017 | $1,262 | $125,002 | $65,000 | $60,002 |
| 2016 | $1,296 | $125,002 | $65,000 | $60,002 |
| 2015 | $1,270 | $123,891 | $58,215 | $65,676 |
| 2014 | -- | $118,559 | $55,709 | $62,850 |
| 2013 | -- | $117,265 | $55,100 | $62,165 |
Source: Public Records
Map
Nearby Homes