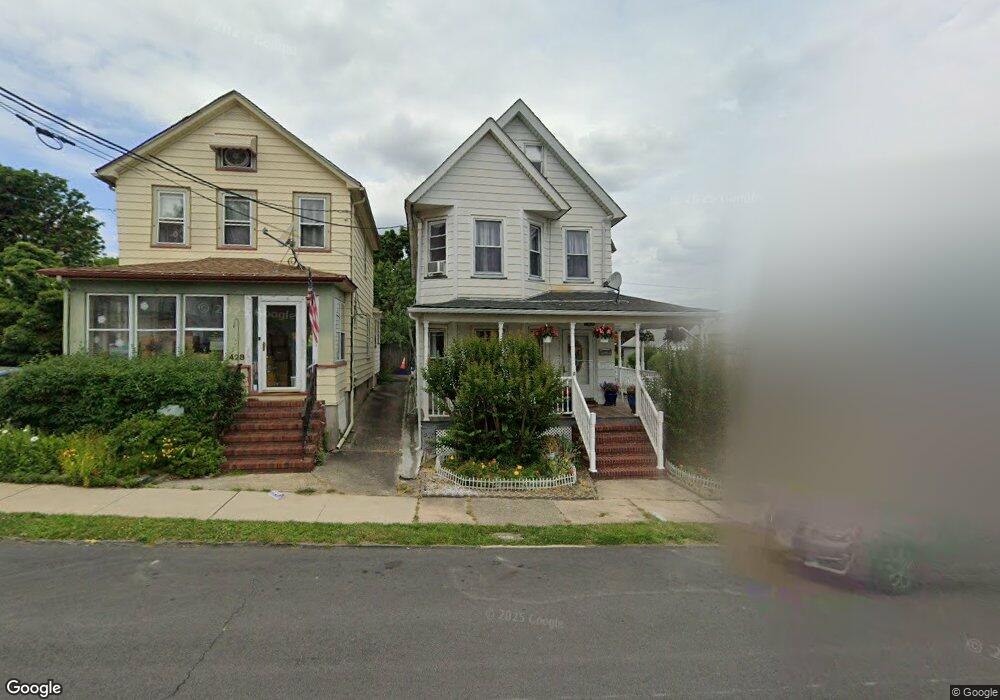
426 David St South Amboy, NJ 08879
Estimated Value: $480,661 - $608,000
--
Bed
--
Bath
1,794
Sq Ft
$295/Sq Ft
Est. Value
About This Home
This home is located at 426 David St, South Amboy, NJ 08879 and is currently estimated at $528,415, approximately $294 per square foot. 426 David St is a home located in Middlesex County with nearby schools including South Amboy Elementary School, South Amboy Middle/High School, and St. Mary Elementary School.
Ownership History
Date
Name
Owned For
Owner Type
Purchase Details
Closed on
May 18, 2013
Bought by
Quispe Hector and Coronado Marleny
Current Estimated Value
Purchase Details
Closed on
Jun 24, 1998
Sold by
Toris Joseph
Bought by
Raneau Roland
Home Financials for this Owner
Home Financials are based on the most recent Mortgage that was taken out on this home.
Original Mortgage
$130,290
Interest Rate
6.94%
Mortgage Type
FHA
Create a Home Valuation Report for This Property
The Home Valuation Report is an in-depth analysis detailing your home's value as well as a comparison with similar homes in the area
Home Values in the Area
Average Home Value in this Area
Purchase History
| Date | Buyer | Sale Price | Title Company |
|---|---|---|---|
| Quispe Hector | -- | -- | |
| Raneau Roland | $131,000 | -- |
Source: Public Records
Mortgage History
| Date | Status | Borrower | Loan Amount |
|---|---|---|---|
| Previous Owner | Raneau Roland | $130,290 |
Source: Public Records
Tax History Compared to Growth
Tax History
| Year | Tax Paid | Tax Assessment Tax Assessment Total Assessment is a certain percentage of the fair market value that is determined by local assessors to be the total taxable value of land and additions on the property. | Land | Improvement |
|---|---|---|---|---|
| 2025 | $8,700 | $271,100 | $125,000 | $146,100 |
| 2024 | $8,372 | $271,100 | $125,000 | $146,100 |
| 2023 | $8,372 | $271,100 | $125,000 | $146,100 |
| 2022 | $7,954 | $271,100 | $125,000 | $146,100 |
| 2021 | $7,821 | $271,100 | $125,000 | $146,100 |
| 2020 | $7,637 | $271,100 | $125,000 | $146,100 |
| 2019 | $7,515 | $271,100 | $125,000 | $146,100 |
| 2018 | $7,453 | $271,100 | $125,000 | $146,100 |
| 2017 | $7,333 | $271,100 | $125,000 | $146,100 |
| 2016 | $7,149 | $271,100 | $125,000 | $146,100 |
| 2015 | $7,200 | $271,100 | $125,000 | $146,100 |
| 2014 | $6,954 | $271,100 | $125,000 | $146,100 |
Source: Public Records
Map
Nearby Homes
- 504 Col Db Kelly Way
- 504 Colonel D B Kelly Way
- 518 Center St
- 322 George St
- 411 Lefferts St
- 101 N Stevens Ave
- 123 S Stevens Ave
- 231 N Stevens Ave
- 326 Walnut St
- 528 Catherine St
- 442 Bordentown Ave
- 251 Church St
- 245 2nd St
- 433 Gordon St
- 15 Bertram Ave
- 223 Henry St
- 237 George St
- 320 Parker Ave
- 209 1st St
- 112 N Broadway Unit C