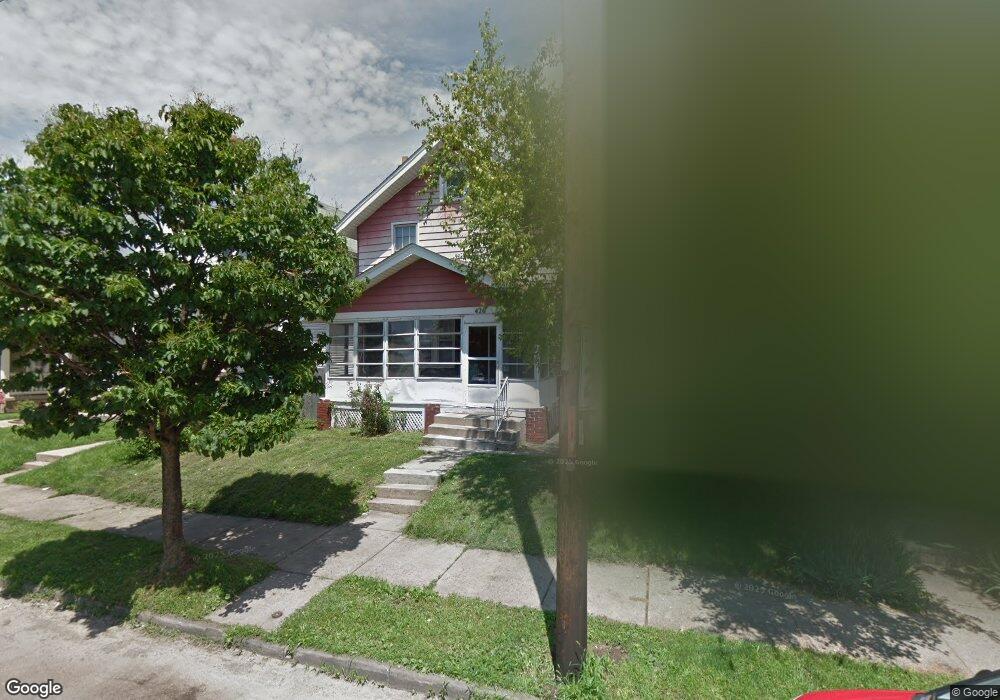
426 E Moler St Columbus, OH 43207
Merion Village NeighborhoodEstimated Value: $212,633 - $331,000
3
Beds
2
Baths
1,344
Sq Ft
$193/Sq Ft
Est. Value
About This Home
This home is located at 426 E Moler St, Columbus, OH 43207 and is currently estimated at $259,158, approximately $192 per square foot. 426 E Moler St is a home located in Franklin County with nearby schools including Southwood Elementary School, South High School, and South Columbus Preparatory Academy.
Ownership History
Date
Name
Owned For
Owner Type
Purchase Details
Closed on
Dec 31, 2018
Sold by
Johnson Francis J and Johnson Kit C
Bought by
Johnson Investments Llc
Current Estimated Value
Purchase Details
Closed on
Jan 9, 2006
Sold by
Mccampbell Deylyne and Jpmorgan Chase Bank Na
Bought by
Johnson Francis J and Johnson Kit C
Purchase Details
Closed on
Jun 21, 1999
Sold by
Bowers Fern and Bowers Fern M
Bought by
Mccampbell Deylyne and Mccampbell Doris
Home Financials for this Owner
Home Financials are based on the most recent Mortgage that was taken out on this home.
Original Mortgage
$61,493
Interest Rate
7.15%
Mortgage Type
FHA
Purchase Details
Closed on
Dec 31, 1998
Sold by
Estate Of Iva Marie Salveto
Bought by
Salveto Paul J and Bowers Fern
Purchase Details
Closed on
May 11, 1989
Bought by
Salveto Iva M
Create a Home Valuation Report for This Property
The Home Valuation Report is an in-depth analysis detailing your home's value as well as a comparison with similar homes in the area
Home Values in the Area
Average Home Value in this Area
Purchase History
| Date | Buyer | Sale Price | Title Company |
|---|---|---|---|
| Johnson Investments Llc | -- | None Available | |
| Johnson Francis J | $75,000 | Fidelity Natl Title Ins Co | |
| Mccampbell Deylyne | $20,700 | -- | |
| Mccampbell Deylyne | $20,700 | -- | |
| Mccampbell Deylyne | $20,700 | -- | |
| Salveto Paul J | -- | -- | |
| Salveto Iva M | -- | -- |
Source: Public Records
Mortgage History
| Date | Status | Borrower | Loan Amount |
|---|---|---|---|
| Previous Owner | Mccampbell Deylyne | $61,493 |
Source: Public Records
Tax History
| Year | Tax Paid | Tax Assessment Tax Assessment Total Assessment is a certain percentage of the fair market value that is determined by local assessors to be the total taxable value of land and additions on the property. | Land | Improvement |
|---|---|---|---|---|
| 2025 | $3,369 | $73,510 | $21,670 | $51,840 |
| 2024 | $3,369 | $73,510 | $21,670 | $51,840 |
| 2023 | $3,364 | $73,500 | $21,665 | $51,835 |
| 2022 | $4,807 | $56,110 | $14,040 | $42,070 |
| 2021 | $2,987 | $56,110 | $14,040 | $42,070 |
| 2020 | $2,992 | $56,110 | $14,040 | $42,070 |
| 2019 | $2,536 | $40,780 | $10,400 | $30,380 |
| 2018 | $2,125 | $40,780 | $10,400 | $30,380 |
| 2017 | $2,226 | $40,780 | $10,400 | $30,380 |
| 2016 | $1,917 | $27,790 | $8,190 | $19,600 |
| 2015 | $1,719 | $27,790 | $8,190 | $19,600 |
| 2014 | $1,723 | $27,790 | $8,190 | $19,600 |
| 2013 | $1,091 | $35,665 | $8,190 | $27,475 |
Source: Public Records
Map
Nearby Homes
- 423 Sheldon Ave
- 415 Sheldon Ave
- 360 Sheldon Ave
- 348-350 E Moler St
- 354 Sheldon Ave
- 523 Hanford St
- 513 E Jenkins Ave
- 515 E Mithoff St
- 272 E Jenkins Ave
- 380 E Markison Ave
- 301 Southwood Ave
- 332 E Mithoff St
- 320 E Mithoff St
- 573 E Mithoff St
- 284-286 E Markison Ave
- 539 Thurman Ave
- 610 Southwood Ave
- 498 Thurman Ave
- 601 Southwood Ave
- 1389 S 6th St
- 420-422 E Moler St
- 420 E Moler St Unit 422
- 430 E Moler St
- 418 E Moler St
- 412-414 E Moler St
- 412 E Moler St Unit 414
- 412 E Moler St
- 431-435 Frebis Ave
- 423 Frebis Ave Unit 427
- 431 Frebis Ave Unit 435
- 408 E Moler St
- 419 Frebis Ave Unit 421
- 419-421 Frebis Ave
- 415 Frebis Ave
- 404 E Moler St
- 411 Frebis Ave Unit 411
- 407 Frebis Ave
- 401 Frebis Ave
- 394 E Moler St
- 390 E Moler St
Your Personal Tour Guide
Ask me questions while you tour the home.