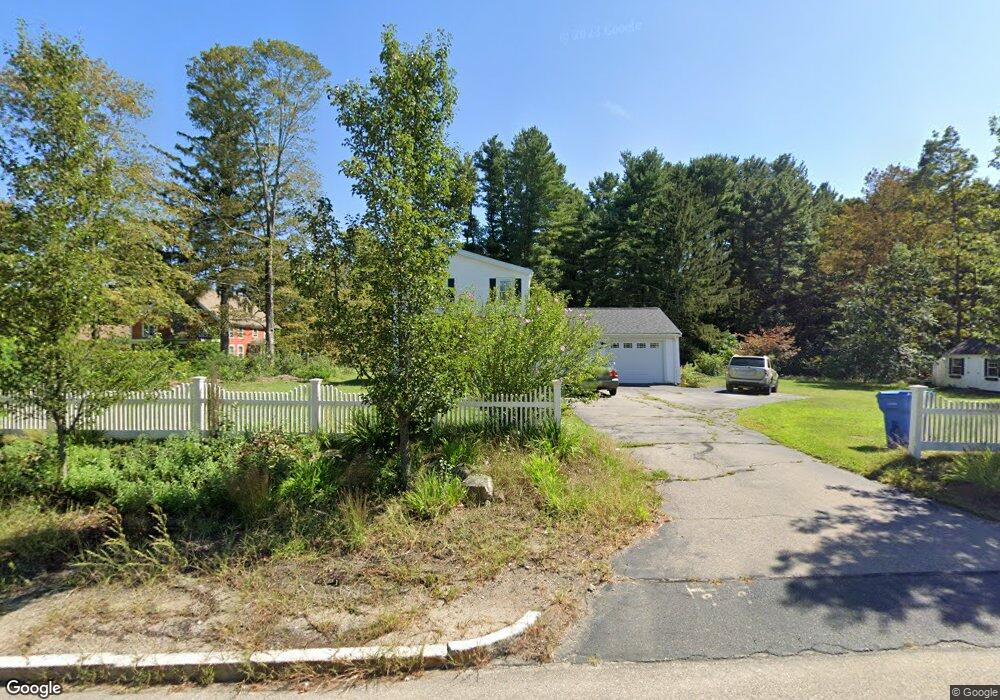
426 East St Wrentham, MA 02093
Estimated Value: $542,000 - $581,114
2
Beds
2
Baths
1,324
Sq Ft
$425/Sq Ft
Est. Value
About This Home
This home is located at 426 East St, Wrentham, MA 02093 and is currently estimated at $562,279, approximately $424 per square foot. 426 East St is a home located in Norfolk County with nearby schools including Delaney Elementary School, Charles E Roderick, and Foxborough Regional Charter School.
Ownership History
Date
Name
Owned For
Owner Type
Purchase Details
Closed on
Aug 22, 2007
Sold by
Quinn Anne H and Quinn Robert J
Bought by
Hough Lee A N
Current Estimated Value
Home Financials for this Owner
Home Financials are based on the most recent Mortgage that was taken out on this home.
Original Mortgage
$225,600
Outstanding Balance
$143,712
Interest Rate
6.78%
Mortgage Type
Purchase Money Mortgage
Estimated Equity
$418,567
Purchase Details
Closed on
Jul 6, 2007
Sold by
Quinn Robert J and Quinn Anne H
Bought by
Ketchum Thomas E and Ketchum Caron B
Home Financials for this Owner
Home Financials are based on the most recent Mortgage that was taken out on this home.
Original Mortgage
$225,600
Outstanding Balance
$143,712
Interest Rate
6.78%
Mortgage Type
Purchase Money Mortgage
Estimated Equity
$418,567
Create a Home Valuation Report for This Property
The Home Valuation Report is an in-depth analysis detailing your home's value as well as a comparison with similar homes in the area
Home Values in the Area
Average Home Value in this Area
Purchase History
| Date | Buyer | Sale Price | Title Company |
|---|---|---|---|
| Hough Lee A N | $282,000 | -- | |
| Ketchum Thomas E | $50,000 | -- |
Source: Public Records
Mortgage History
| Date | Status | Borrower | Loan Amount |
|---|---|---|---|
| Open | Hough Lee A N | $225,600 |
Source: Public Records
Tax History Compared to Growth
Tax History
| Year | Tax Paid | Tax Assessment Tax Assessment Total Assessment is a certain percentage of the fair market value that is determined by local assessors to be the total taxable value of land and additions on the property. | Land | Improvement |
|---|---|---|---|---|
| 2025 | $6,274 | $541,300 | $274,100 | $267,200 |
| 2024 | $5,939 | $494,900 | $274,100 | $220,800 |
| 2023 | $5,812 | $460,500 | $249,200 | $211,300 |
| 2022 | $5,446 | $398,400 | $224,300 | $174,100 |
| 2021 | $5,234 | $372,000 | $200,500 | $171,500 |
| 2020 | $5,177 | $363,300 | $183,000 | $180,300 |
| 2019 | $4,816 | $341,100 | $166,400 | $174,700 |
| 2018 | $4,723 | $331,700 | $166,700 | $165,000 |
| 2017 | $4,603 | $323,000 | $163,400 | $159,600 |
| 2016 | $4,414 | $309,100 | $158,700 | $150,400 |
| 2015 | $4,436 | $296,100 | $152,600 | $143,500 |
| 2014 | $4,363 | $285,000 | $146,700 | $138,300 |
Source: Public Records
Map
Nearby Homes
- 362 East St
- 155 Clark Rd Unit 155
- 1 Lorraine Metcalf Dr
- 270 Dedham St
- 65 Pond St
- 10 Nature View Dr
- 15 Nature View Dr
- 319 Taunton St
- 120 Hawes St
- 483 Thurston St
- 25 Foxboro Rd
- 131 Creek St Unit 7
- 11 Goodwin Dr
- 11 Earle Stewart Ln
- Lot 3 - 14 Earle Stewart Ln
- Lot 1 - Blueberry 2 Car Plan at King Philip Estates
- Lot 8 - Blueberry 2 Car Plan at King Philip Estates
- Lot 5 - Hughes 2 car Plan at King Philip Estates
- Lot 6 - Blueberry 3 Car Plan at King Philip Estates
- Lot 2 - Camden 2 Car Plan at King Philip Estates