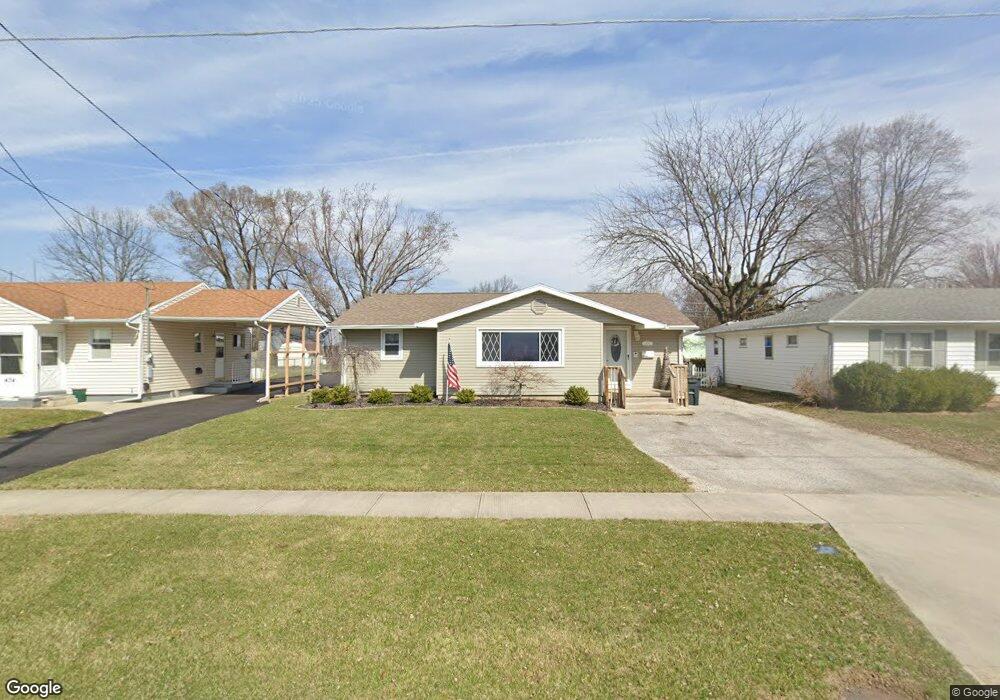
426 Edith Ave Findlay, OH 45840
Estimated Value: $161,000 - $179,253
3
Beds
2
Baths
1,192
Sq Ft
$142/Sq Ft
Est. Value
About This Home
This home is located at 426 Edith Ave, Findlay, OH 45840 and is currently estimated at $169,813, approximately $142 per square foot. 426 Edith Ave is a home located in Hancock County with nearby schools including Northview Elementary School, Bigelow Hill Elementary School, and Glenwood Middle School.
Ownership History
Date
Name
Owned For
Owner Type
Purchase Details
Closed on
Sep 25, 2023
Sold by
Maidment Patricia J and Myers James
Bought by
Ruble Thomas A and Ruble Cathy L
Current Estimated Value
Home Financials for this Owner
Home Financials are based on the most recent Mortgage that was taken out on this home.
Original Mortgage
$124,135
Outstanding Balance
$121,680
Interest Rate
7.09%
Mortgage Type
FHA
Estimated Equity
$48,133
Purchase Details
Closed on
Jun 28, 2006
Sold by
Gardner Rickie L and Gardner Rhonda S
Bought by
Maidment Patricia J and Myers James
Home Financials for this Owner
Home Financials are based on the most recent Mortgage that was taken out on this home.
Original Mortgage
$108,000
Interest Rate
6.73%
Mortgage Type
Credit Line Revolving
Create a Home Valuation Report for This Property
The Home Valuation Report is an in-depth analysis detailing your home's value as well as a comparison with similar homes in the area
Home Values in the Area
Average Home Value in this Area
Purchase History
| Date | Buyer | Sale Price | Title Company |
|---|---|---|---|
| Ruble Thomas A | $130,000 | None Listed On Document | |
| Maidment Patricia J | $120,000 | Whitman Title Security |
Source: Public Records
Mortgage History
| Date | Status | Borrower | Loan Amount |
|---|---|---|---|
| Open | Ruble Thomas A | $124,135 | |
| Previous Owner | Maidment Patricia J | $108,000 |
Source: Public Records
Tax History
| Year | Tax Paid | Tax Assessment Tax Assessment Total Assessment is a certain percentage of the fair market value that is determined by local assessors to be the total taxable value of land and additions on the property. | Land | Improvement |
|---|---|---|---|---|
| 2024 | $1,745 | $49,100 | $5,730 | $43,370 |
| 2023 | $1,747 | $49,100 | $5,730 | $43,370 |
| 2022 | $1,794 | $49,100 | $5,730 | $43,370 |
| 2021 | $1,639 | $39,250 | $5,740 | $33,510 |
| 2020 | $1,639 | $39,250 | $5,740 | $33,510 |
| 2019 | $1,745 | $39,250 | $5,740 | $33,510 |
| 2018 | $1,565 | $32,590 | $4,590 | $28,000 |
| 2017 | $1,455 | $32,590 | $4,590 | $28,000 |
| 2016 | $1,442 | $32,590 | $4,590 | $28,000 |
| 2015 | $1,396 | $31,030 | $4,590 | $26,440 |
| 2014 | $1,396 | $31,030 | $4,590 | $26,440 |
| 2012 | $1,406 | $31,030 | $4,590 | $26,440 |
Source: Public Records
Map
Nearby Homes
- 2318 Anna St
- 315 W Melrose Ave
- 528 Rector Ave
- 239 Edith Ave
- 701 W Melrose Ave
- 724 Edith Ave
- 2419 Hollybrook Dr
- 421 Clifton Ave
- 400 Rosewood Ave
- 405 Clifton Ave
- 2400 Hollybrook Dr
- 217 Prentiss Ave
- 2605 Eton Place
- 245 Edinborough Dr
- 120 W Melrose Ave
- 243 Monroe Ave
- 146 Clifton Ave
- 140 Monroe Ave
- 925 W Melrose Ave
- 2604 N Main St
- 434 Edith Ave
- 416 Edith Ave
- 438 Edith Ave
- 421 W Melrose Ave
- 425 W Melrose Ave
- 419 W Melrose Ave
- 408 Edith Ave
- 429 W Melrose Ave
- 500 Edith Ave
- 415 W Melrose Ave
- 425 Edith Ave
- 419 Edith Ave
- 435 Edith Ave
- 501 W Melrose Ave
- 409 W Melrose Ave
- 415 Edith Ave
- 439 Edith Ave
- 504 Edith Ave
- 411 Edith Ave
- 400 Edith Ave
Your Personal Tour Guide
Ask me questions while you tour the home.