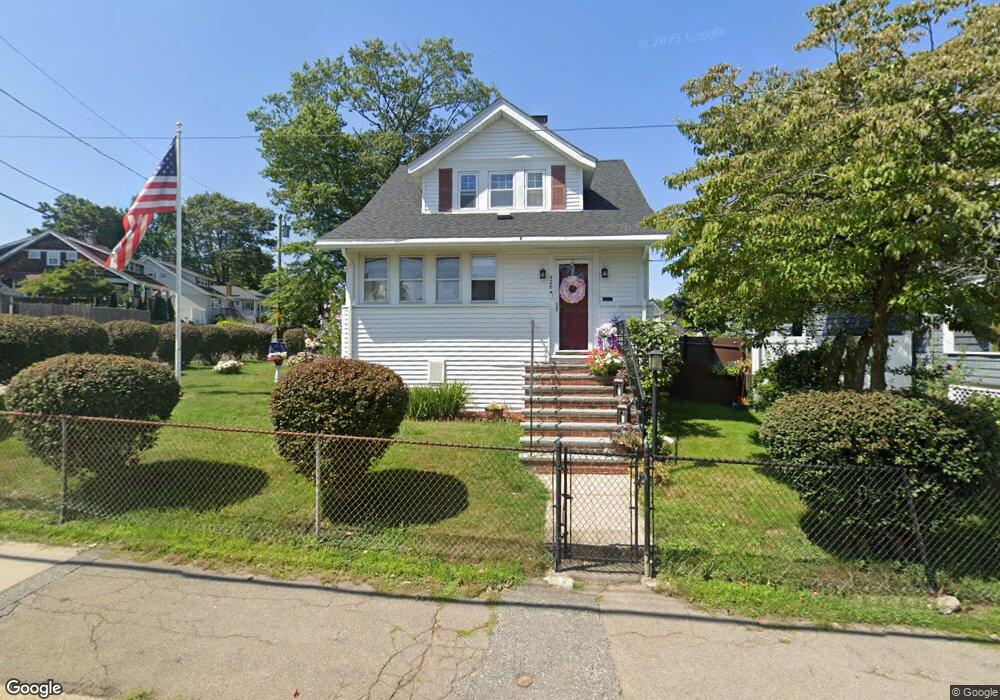
426 Elm St Braintree, MA 02184
East Braintree NeighborhoodEstimated Value: $617,000 - $639,000
2
Beds
2
Baths
1,478
Sq Ft
$425/Sq Ft
Est. Value
About This Home
This home is located at 426 Elm St, Braintree, MA 02184 and is currently estimated at $628,048, approximately $424 per square foot. 426 Elm St is a home located in Norfolk County with nearby schools including Braintree High School, Step Ahead Kindergarten, and Meeting House Montessori School.
Ownership History
Date
Name
Owned For
Owner Type
Purchase Details
Closed on
Jul 31, 2006
Sold by
Mclaughlin William Y
Bought by
Mclaughlin Lindsey and Mclaughlin William Y
Current Estimated Value
Home Financials for this Owner
Home Financials are based on the most recent Mortgage that was taken out on this home.
Original Mortgage
$383,500
Outstanding Balance
$229,120
Interest Rate
6.67%
Mortgage Type
Purchase Money Mortgage
Estimated Equity
$398,928
Purchase Details
Closed on
Oct 21, 2003
Sold by
Mclaughlin Mary C
Bought by
Mclaughlin William Y and Mclaughlin Lindsey
Home Financials for this Owner
Home Financials are based on the most recent Mortgage that was taken out on this home.
Original Mortgage
$240,000
Interest Rate
6.43%
Mortgage Type
Purchase Money Mortgage
Create a Home Valuation Report for This Property
The Home Valuation Report is an in-depth analysis detailing your home's value as well as a comparison with similar homes in the area
Home Values in the Area
Average Home Value in this Area
Purchase History
We collect this data history from publicly available records. To have your information removed, we recommend requesting removal directly through your county’s website.
| Date | Buyer | Sale Price | Title Company |
|---|---|---|---|
| Mclaughlin Lindsey | -- | -- | |
| Mclaughlin William Y | $191,500 | -- |
Source: Public Records
Mortgage History
We collect this data history from publicly available records. To have your information removed, we recommend requesting removal directly through your county’s website.
| Date | Status | Borrower | Loan Amount |
|---|---|---|---|
| Open | Mclaughlin Lindsey | $383,500 | |
| Previous Owner | Mclaughlin William Y | $240,000 |
Source: Public Records
Tax History
| Year | Tax Paid | Tax Assessment Tax Assessment Total Assessment is a certain percentage of the fair market value that is determined by local assessors to be the total taxable value of land and additions on the property. | Land | Improvement |
|---|---|---|---|---|
| 2025 | $5,551 | $556,200 | $300,700 | $255,500 |
| 2024 | $5,025 | $530,100 | $277,900 | $252,200 |
| 2023 | $4,817 | $493,500 | $255,200 | $238,300 |
| 2022 | $4,728 | $475,200 | $236,900 | $238,300 |
| 2021 | $4,410 | $443,200 | $218,700 | $224,500 |
| 2020 | $4,274 | $433,500 | $218,700 | $214,800 |
| 2019 | $4,230 | $419,200 | $218,700 | $200,500 |
| 2018 | $3,850 | $365,300 | $173,100 | $192,200 |
| 2017 | $3,609 | $336,000 | $154,900 | $181,100 |
| 2016 | $3,523 | $320,900 | $136,700 | $184,200 |
| 2015 | $3,418 | $308,800 | $131,200 | $177,600 |
| 2014 | $3,375 | $295,500 | $131,200 | $164,300 |
Source: Public Records
Map
Nearby Homes
- 115 Hawthorn Rd
- 27 Cindy Ln
- 199 Hawthorn Rd
- 30 Church St Unit 12
- 146 Hayward St
- 28 Hillcrest Rd
- 30 Skyline Dr Unit 6
- 296 Commercial St Unit 21
- 25 Fairmount Ave
- 7 Somerville Ave
- 37 Skyline Dr Unit 11
- 9 Independence Ave Unit 102
- 11 Oak Grove Terrace Unit 303
- 11 Oak Grove Terrace Unit 402
- 25 W Howard St Unit G3
- 24 Hillside Ave
- 3 Harrison Ave
- 16 Cotton Ave
- 485 Union St
- 21 Spaulding St
Your Personal Tour Guide
Ask me questions while you tour the home.