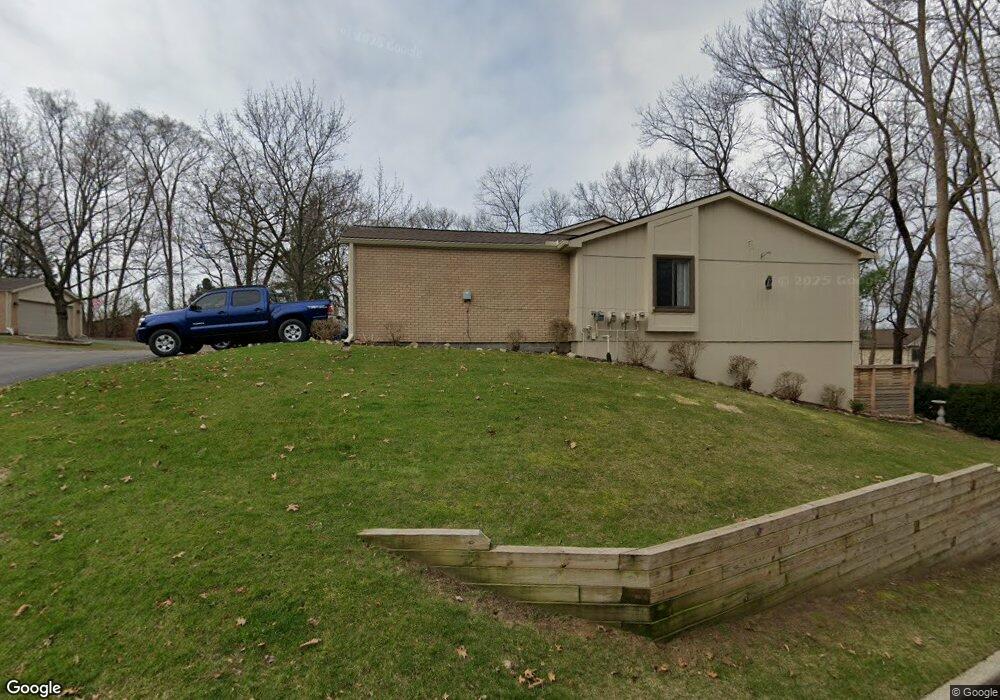
426 Forest Dr Unit 4 17 Brighton, MI 48116
Estimated Value: $247,000 - $252,000
2
Beds
2
Baths
1,160
Sq Ft
$215/Sq Ft
Est. Value
About This Home
This home is located at 426 Forest Dr Unit 4 17, Brighton, MI 48116 and is currently estimated at $249,134, approximately $214 per square foot. 426 Forest Dr Unit 4 17 is a home located in Livingston County with nearby schools including Hilton Road Elementary School, Scranton Middle School, and Brighton High School.
Ownership History
Date
Name
Owned For
Owner Type
Purchase Details
Closed on
Aug 27, 2025
Sold by
Oneill Ryan and Oneill Heather
Bought by
Pallo Austin
Current Estimated Value
Purchase Details
Closed on
Oct 29, 2021
Sold by
Potter Andrew
Bought by
Oneill Ryan and Oneill Heather
Purchase Details
Closed on
Nov 3, 2017
Sold by
Podgorski Edmund
Bought by
Potter Andrew
Home Financials for this Owner
Home Financials are based on the most recent Mortgage that was taken out on this home.
Original Mortgage
$142,500
Interest Rate
3.85%
Mortgage Type
New Conventional
Purchase Details
Closed on
Apr 25, 2014
Sold by
Rae Lynn
Bought by
Podgorski Edmund
Purchase Details
Closed on
May 31, 2011
Sold by
Schulenburg Sandra
Bought by
Rae Lynn
Purchase Details
Closed on
Apr 26, 2005
Sold by
Dykstra Gladys M and Schulenburg Sandra R
Bought by
Trustee Of The Gladys M Dykstra Declarat and Dykstra Gladys M
Create a Home Valuation Report for This Property
The Home Valuation Report is an in-depth analysis detailing your home's value as well as a comparison with similar homes in the area
Home Values in the Area
Average Home Value in this Area
Purchase History
| Date | Buyer | Sale Price | Title Company |
|---|---|---|---|
| Oneill Ryan | $185,000 | None Available | |
| Potter Andrew | $150,000 | -- | |
| Podgorski Edmund | $108,500 | -- | |
| Rae Lynn | $90,000 | -- | |
| Trustee Of The Gladys M Dykstra Declarat | -- | -- |
Source: Public Records
Mortgage History
| Date | Status | Borrower | Loan Amount |
|---|---|---|---|
| Previous Owner | Potter Andrew | $142,500 |
Source: Public Records
Tax History Compared to Growth
Tax History
| Year | Tax Paid | Tax Assessment Tax Assessment Total Assessment is a certain percentage of the fair market value that is determined by local assessors to be the total taxable value of land and additions on the property. | Land | Improvement |
|---|---|---|---|---|
| 2025 | $3,707 | $108,000 | $0 | $0 |
| 2024 | $2,866 | $101,900 | $0 | $0 |
| 2023 | $2,729 | $88,400 | $0 | $0 |
| 2022 | $3,056 | $71,200 | $0 | $0 |
| 2021 | $3,056 | $85,700 | $0 | $0 |
| 2020 | $3,039 | $72,500 | $0 | $0 |
| 2019 | $3,013 | $71,200 | $0 | $0 |
| 2018 | $2,803 | $70,900 | $0 | $0 |
| 2017 | $2,427 | $71,900 | $0 | $0 |
| 2016 | $2,250 | $62,100 | $0 | $0 |
| 2014 | $2,997 | $47,700 | $0 | $0 |
| 2012 | $2,997 | $45,390 | $0 | $0 |
Source: Public Records
Map
Nearby Homes
- 119 Pondview Ct Unit 9
- 504 Anne Ave
- 584 Anne Ave
- 507 Anne Ave
- 566 Foxboro Square
- 4633 Crestway Dr
- 624 E Main St
- 4505 Spring Mountain Dr
- 122 E North St
- 212 S East St
- 116 E North St
- 8741 Green Willow St Unit 11
- 8737 Green Willow St
- 8719 Meadowbrook Dr Unit 5
- 8711 Candlewood Trail Unit 5
- 292 N 1st St
- 4125 Flint Rd
- 302 N 2nd St Unit 5
- 4259 Deeside Dr
- 315 S 1st St
- 426 Forest Dr Unit 17
- 424 Forest Dr
- 428 Forest Dr
- 428 Forest Dr Unit 18
- 422 Forest Dr Unit 15
- 410 Forest Dr
- 412 Forest Dr
- 412 Forest Dr Unit 5
- 414 Forest Dr Unit 4
- 416 Forest Dr Unit 3
- 432 Forest Dr Unit 22
- 434 Forest Dr Unit 21
- 436 Forest Dr Unit 20
- 438 Forest Dr Unit 19
- 417 Forest Dr Unit 11
- 707 Nelson St
- 715 Nelson St
- 711 Nelson St
- 703 Nelson St
- 408 Forest Dr