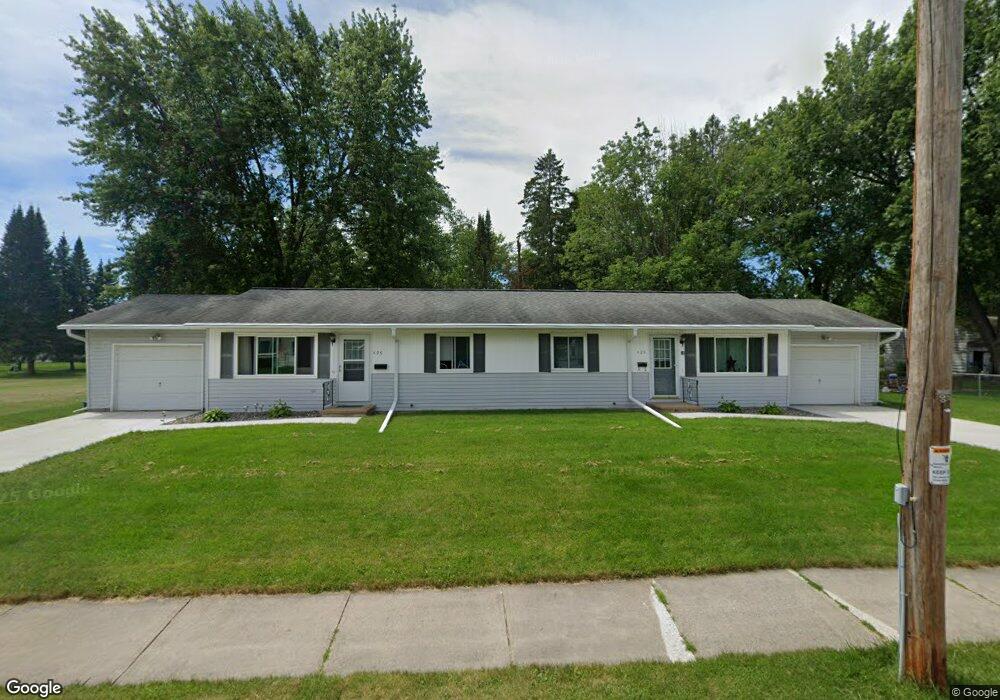
426 Hogan St Unit 1 Antigo, WI 54409
Estimated Value: $148,000 - $227,000
3
Beds
--
Bath
1,560
Sq Ft
$126/Sq Ft
Est. Value
About This Home
This home is located at 426 Hogan St Unit 1, Antigo, WI 54409 and is currently estimated at $196,324, approximately $125 per square foot. 426 Hogan St Unit 1 is a home located in Langlade County with nearby schools including Antigo High School, Peace Lutheran School, and All Saints Catholic School.
Ownership History
Date
Name
Owned For
Owner Type
Purchase Details
Closed on
Mar 26, 2021
Sold by
Stacy Luebbe
Bought by
Watertight Developments Llc
Current Estimated Value
Home Financials for this Owner
Home Financials are based on the most recent Mortgage that was taken out on this home.
Interest Rate
3.17%
Purchase Details
Closed on
Mar 10, 2021
Sold by
Estate Of Pamela J Luebbe
Bought by
Luebbe Stacy
Home Financials for this Owner
Home Financials are based on the most recent Mortgage that was taken out on this home.
Interest Rate
3.17%
Purchase Details
Closed on
Jun 9, 2017
Sold by
Keen'S Rental Llc
Bought by
Luebbe Pamela J
Create a Home Valuation Report for This Property
The Home Valuation Report is an in-depth analysis detailing your home's value as well as a comparison with similar homes in the area
Home Values in the Area
Average Home Value in this Area
Purchase History
| Date | Buyer | Sale Price | Title Company |
|---|---|---|---|
| Watertight Developments Llc | $131,900 | -- | |
| Luebbe Stacy | $48,000 | -- | |
| Luebbe Pamela J | $117,000 | -- |
Source: Public Records
Mortgage History
| Date | Status | Borrower | Loan Amount |
|---|---|---|---|
| Closed | Luebbe Stacy | -- |
Source: Public Records
Tax History Compared to Growth
Tax History
| Year | Tax Paid | Tax Assessment Tax Assessment Total Assessment is a certain percentage of the fair market value that is determined by local assessors to be the total taxable value of land and additions on the property. | Land | Improvement |
|---|---|---|---|---|
| 2024 | $3,554 | $190,500 | $11,700 | $178,800 |
| 2023 | $2,673 | $108,800 | $9,800 | $99,000 |
| 2022 | $2,417 | $108,800 | $9,800 | $99,000 |
| 2021 | $2,606 | $108,800 | $9,800 | $99,000 |
| 2020 | $2,745 | $108,800 | $9,800 | $99,000 |
| 2019 | $2,608 | $108,800 | $9,800 | $99,000 |
| 2018 | $2,513 | $108,800 | $9,800 | $99,000 |
| 2017 | $2,428 | $108,800 | $9,800 | $99,000 |
| 2016 | $2,577 | $108,800 | $9,800 | $99,000 |
| 2015 | $2,631 | $108,800 | $9,800 | $99,000 |
| 2014 | $2,768 | $118,200 | $9,500 | $108,700 |
| 2013 | $2,823 | $118,200 | $9,500 | $108,700 |
Source: Public Records
Map
Nearby Homes