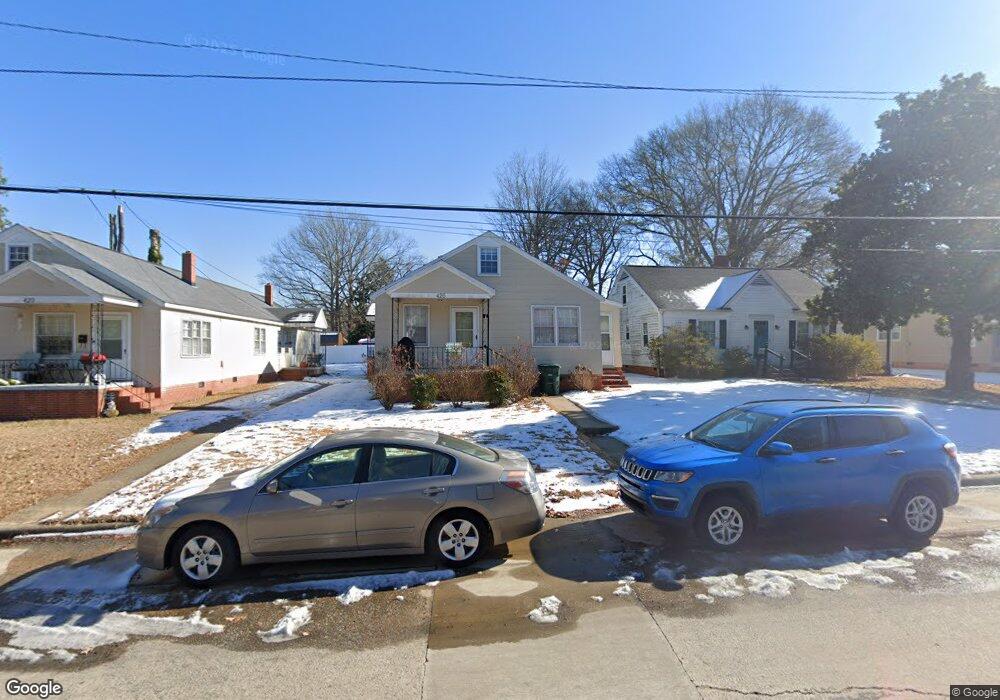
426 Jackson St Roanoke Rapids, NC 27870
Estimated Value: $70,000 - $168,000
3
Beds
3
Baths
1,936
Sq Ft
$55/Sq Ft
Est. Value
About This Home
This home is located at 426 Jackson St, Roanoke Rapids, NC 27870 and is currently estimated at $106,333, approximately $54 per square foot. 426 Jackson St is a home located in Halifax County with nearby schools including Roanoke Rapids High School and Victory Christian Academy.
Ownership History
Date
Name
Owned For
Owner Type
Purchase Details
Closed on
Sep 26, 2022
Sold by
Roland Bailey Dennis and Hagan Ann
Bought by
Crew Investments Inc
Current Estimated Value
Home Financials for this Owner
Home Financials are based on the most recent Mortgage that was taken out on this home.
Original Mortgage
$225,000
Outstanding Balance
$215,930
Interest Rate
5.66%
Mortgage Type
New Conventional
Estimated Equity
-$109,597
Purchase Details
Closed on
Jul 21, 2000
Bought by
Bailey Dennis R and Bailey Bailey,Ann H
Create a Home Valuation Report for This Property
The Home Valuation Report is an in-depth analysis detailing your home's value as well as a comparison with similar homes in the area
Purchase History
| Date | Buyer | Sale Price | Title Company |
|---|---|---|---|
| Crew Investments Inc | $300,000 | -- | |
| Bailey Dennis R | $105,000 | -- |
Source: Public Records
Mortgage History
| Date | Status | Borrower | Loan Amount |
|---|---|---|---|
| Open | Crew Investments Inc | $225,000 |
Source: Public Records
Tax History
| Year | Tax Paid | Tax Assessment Tax Assessment Total Assessment is a certain percentage of the fair market value that is determined by local assessors to be the total taxable value of land and additions on the property. | Land | Improvement |
|---|---|---|---|---|
| 2025 | $17 | $70,100 | $16,800 | $53,300 |
| 2024 | $17 | $70,100 | $16,800 | $53,300 |
| 2023 | $1,645 | $61,400 | $16,800 | $44,600 |
| 2022 | $1,631 | $61,400 | $16,800 | $44,600 |
| 2021 | $1,546 | $61,400 | $16,800 | $44,600 |
| 2020 | $1,523 | $61,400 | $16,800 | $44,600 |
| 2019 | $1,457 | $51,400 | $16,800 | $34,600 |
| 2018 | $1,449 | $56,600 | $16,800 | $39,800 |
| 2017 | $1,399 | $56,600 | $16,800 | $39,800 |
| 2016 | $1,465 | $56,600 | $16,800 | $39,800 |
| 2015 | $1,405 | $56,600 | $16,800 | $39,800 |
| 2014 | $1,403 | $60,130 | $18,150 | $41,980 |
Source: Public Records
Map
Nearby Homes
- 410 Madison St
- 525 Hamilton St
- 414 Monroe St
- 537 Jefferson St
- 112 E 7th St
- 218 Jefferson St
- 417 Marshall St
- 638 A B Jefferson St
- 611 Marshall St
- 808 Monroe St
- 700 Vance St
- 106 Washington St
- 2124 N Carolina 48
- 3rd Straight Rd
- 340 Rapids St
- 638 Rapids St
- 823 W 5th St
- 909 Monroe St
- 506 Virginia St
- 2077, 91 W 10th St
Your Personal Tour Guide
Ask me questions while you tour the home.