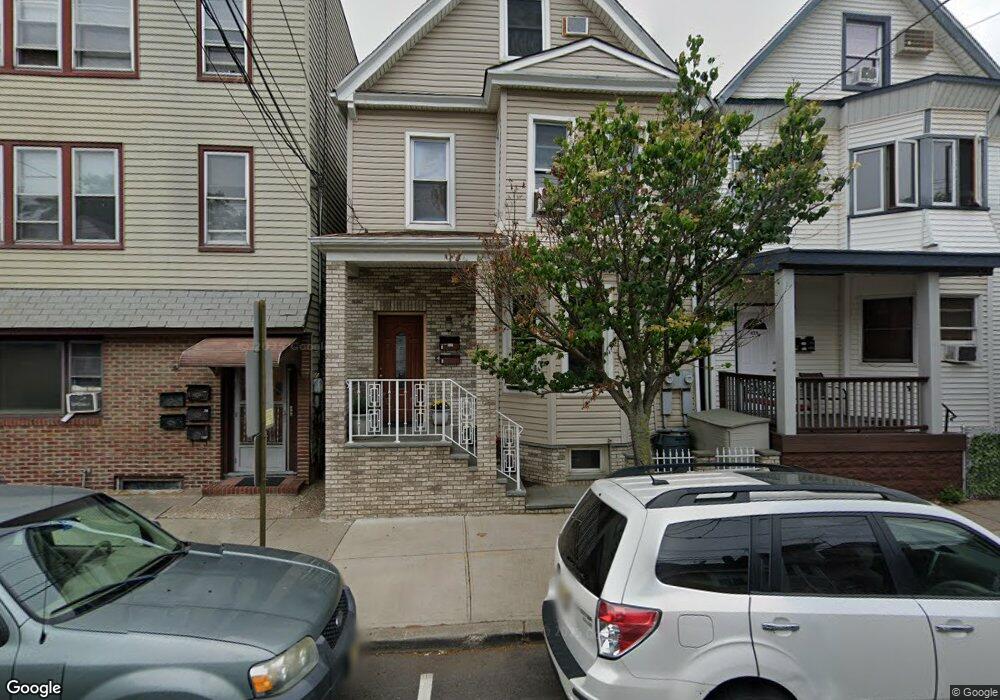
426 John St East Newark, NJ 07029
Estimated Value: $585,027 - $721,000
--
Bed
--
Bath
2,575
Sq Ft
$246/Sq Ft
Est. Value
About This Home
This home is located at 426 John St, East Newark, NJ 07029 and is currently estimated at $634,007, approximately $246 per square foot. 426 John St is a home located in Hudson County with nearby schools including East Newark Public School, Kearny Christian Academy, and Marwah Academy.
Ownership History
Date
Name
Owned For
Owner Type
Purchase Details
Closed on
Mar 26, 2003
Sold by
Ruiz Jorge Felix
Bought by
Zajkowski Henryk and Zajkowska Joanna
Current Estimated Value
Home Financials for this Owner
Home Financials are based on the most recent Mortgage that was taken out on this home.
Original Mortgage
$176,000
Interest Rate
5.86%
Mortgage Type
Stand Alone First
Purchase Details
Closed on
Jun 19, 2000
Sold by
Ruiz Felix and Ruiz Nelly
Bought by
Ruiz Jorge Feliz
Create a Home Valuation Report for This Property
The Home Valuation Report is an in-depth analysis detailing your home's value as well as a comparison with similar homes in the area
Home Values in the Area
Average Home Value in this Area
Purchase History
| Date | Buyer | Sale Price | Title Company |
|---|---|---|---|
| Zajkowski Henryk | $220,000 | -- | |
| Ruiz Jorge Feliz | -- | -- |
Source: Public Records
Mortgage History
| Date | Status | Borrower | Loan Amount |
|---|---|---|---|
| Previous Owner | Zajkowski Henryk | $176,000 |
Source: Public Records
Tax History Compared to Growth
Tax History
| Year | Tax Paid | Tax Assessment Tax Assessment Total Assessment is a certain percentage of the fair market value that is determined by local assessors to be the total taxable value of land and additions on the property. | Land | Improvement |
|---|---|---|---|---|
| 2025 | $8,625 | $291,100 | $58,200 | $232,900 |
| 2024 | $8,183 | $291,100 | $58,200 | $232,900 |
| 2023 | $8,183 | $291,100 | $58,200 | $232,900 |
| 2022 | $7,950 | $291,100 | $58,200 | $232,900 |
| 2021 | $7,909 | $291,100 | $58,200 | $232,900 |
| 2020 | $7,589 | $291,100 | $58,200 | $232,900 |
| 2019 | $7,592 | $291,100 | $58,200 | $232,900 |
| 2018 | $7,443 | $291,100 | $58,200 | $232,900 |
| 2017 | $7,376 | $291,100 | $58,200 | $232,900 |
| 2016 | $8,011 | $86,800 | $14,400 | $72,400 |
| 2015 | $7,868 | $86,800 | $14,400 | $72,400 |
| 2014 | $7,911 | $86,800 | $14,400 | $72,400 |
Source: Public Records
Map
Nearby Homes
- 441 John St
- 351 N 2nd St
- 344 John St
- 349 N 2nd St
- 213 Central Ave
- 313 Central Ave
- 607 Frank E Rodgers Blvd N
- 115 Grant Ave
- 221 William St
- 430 Central Ave
- 105 Grant Ave
- 100 Grant Ave
- 323 William St
- 28 Grant Ave
- 228 Hamilton St
- 310 Passaic Ave Unit 308
- 59 Rose St
- 118 Maple St
- 39 Alexander Ave
- 503 Cross St