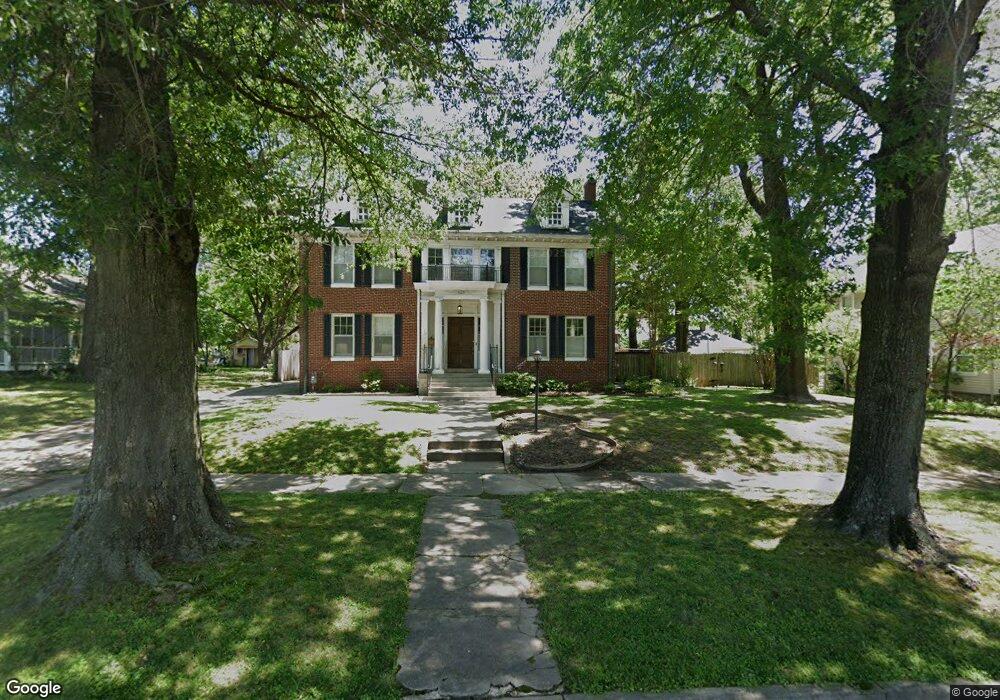
426 N 16th St Muskogee, OK 74401
Central Muskogee NeighborhoodEstimated Value: $178,000 - $322,000
4
Beds
3
Baths
2,282
Sq Ft
$111/Sq Ft
Est. Value
About This Home
This home is located at 426 N 16th St, Muskogee, OK 74401 and is currently estimated at $253,876, approximately $111 per square foot. 426 N 16th St is a home located in Muskogee County with nearby schools including Benjamin Franklin Science Academy, 8th & 9th Grade Academy @ Alice Robertson, and Muskogee High School.
Ownership History
Date
Name
Owned For
Owner Type
Purchase Details
Closed on
Apr 27, 2021
Sold by
Whitaker Anita
Bought by
Webb James Ray and Webb Gigi Renee
Current Estimated Value
Purchase Details
Closed on
May 4, 2020
Sold by
Whitaker Zachary Owen and Whitaker Jefferson Cole
Bought by
Whitaker Les and Whitaker Julie
Purchase Details
Closed on
Nov 15, 2016
Sold by
Whitaker Les Alan and Whitaker Crystal
Bought by
Whitaker Anita
Home Financials for this Owner
Home Financials are based on the most recent Mortgage that was taken out on this home.
Original Mortgage
$122,890
Interest Rate
3.47%
Mortgage Type
Purchase Money Mortgage
Purchase Details
Closed on
Aug 17, 1995
Bought by
Whitaker Les
Purchase Details
Closed on
Jan 1, 1992
Purchase Details
Closed on
Sep 1, 1991
Purchase Details
Closed on
Jan 1, 1986
Create a Home Valuation Report for This Property
The Home Valuation Report is an in-depth analysis detailing your home's value as well as a comparison with similar homes in the area
Home Values in the Area
Average Home Value in this Area
Purchase History
| Date | Buyer | Sale Price | Title Company |
|---|---|---|---|
| Webb James Ray | $240,000 | Muskogee Abstract & Title Co | |
| Whitaker Les | -- | None Available | |
| Whitaker Anita | -- | None Available | |
| Whitaker Les | -- | -- | |
| -- | -- | -- | |
| -- | -- | -- | |
| -- | $95,000 | -- |
Source: Public Records
Mortgage History
| Date | Status | Borrower | Loan Amount |
|---|---|---|---|
| Previous Owner | Whitaker Anita | $122,890 |
Source: Public Records
Tax History Compared to Growth
Tax History
| Year | Tax Paid | Tax Assessment Tax Assessment Total Assessment is a certain percentage of the fair market value that is determined by local assessors to be the total taxable value of land and additions on the property. | Land | Improvement |
|---|---|---|---|---|
| 2025 | $2,679 | $25,815 | $825 | $24,990 |
| 2024 | $2,679 | $24,586 | $825 | $23,761 |
| 2023 | $2,679 | $26,400 | $3 | $26,397 |
| 2022 | $2,631 | $26,400 | $3 | $26,397 |
| 2021 | $1,484 | $14,821 | $660 | $14,161 |
| 2020 | $1,486 | $14,821 | $660 | $14,161 |
| 2019 | $1,425 | $14,325 | $660 | $13,665 |
| 2018 | $1,396 | $14,325 | $660 | $13,665 |
| 2017 | $1,364 | $14,324 | $660 | $13,664 |
| 2016 | $1,364 | $14,324 | $660 | $13,664 |
| 2015 | $1,376 | $14,324 | $660 | $13,664 |
| 2014 | $0 | $14,324 | $660 | $13,664 |
Source: Public Records
Map
Nearby Homes