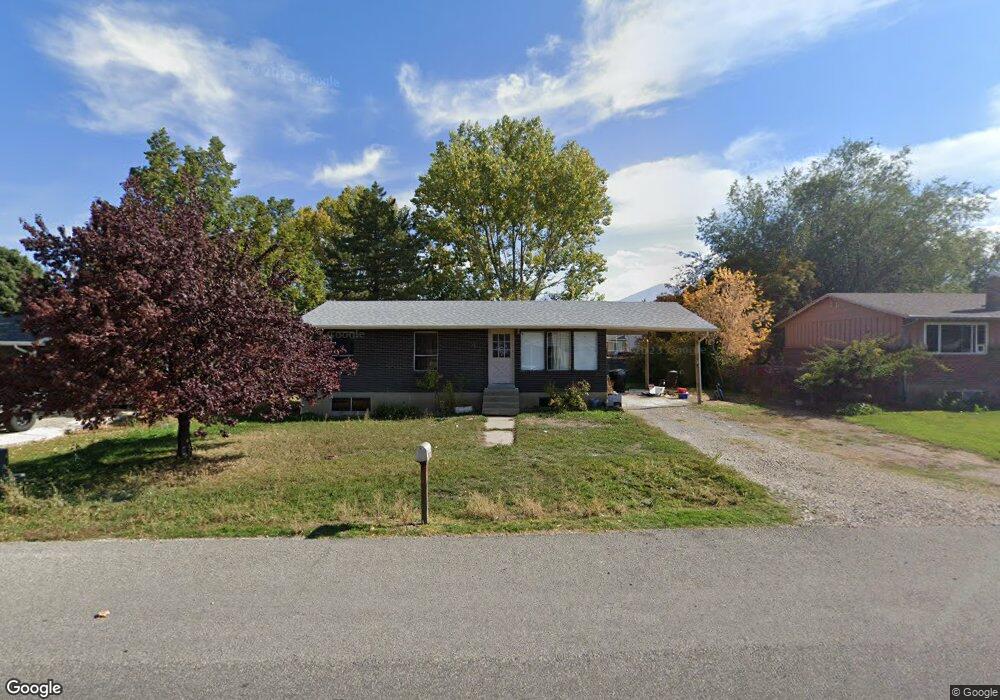
426 N 200 W Payson, UT 84651
Estimated Value: $370,000 - $427,000
3
Beds
1
Bath
1,824
Sq Ft
$219/Sq Ft
Est. Value
About This Home
This home is located at 426 N 200 W, Payson, UT 84651 and is currently estimated at $399,324, approximately $218 per square foot. 426 N 200 W is a home located in Utah County with nearby schools including Taylor Elementary School, Salem Junior High School, and Valley View Middle School.
Ownership History
Date
Name
Owned For
Owner Type
Purchase Details
Closed on
May 28, 2025
Sold by
Jones Myron R and Henley Jerry
Bought by
Strain Braxton
Current Estimated Value
Home Financials for this Owner
Home Financials are based on the most recent Mortgage that was taken out on this home.
Original Mortgage
$412,686
Outstanding Balance
$411,631
Interest Rate
6.83%
Mortgage Type
FHA
Estimated Equity
-$12,307
Purchase Details
Closed on
Jul 22, 2024
Sold by
Johnston Development Llc
Bought by
Jones Myron R and Henley Jerry
Purchase Details
Closed on
Oct 3, 2023
Sold by
Lee Richard
Bought by
Johnston Development Llc
Purchase Details
Closed on
Oct 25, 2000
Sold by
Lee Richard L and Lee Cheryl S
Bought by
Lee Richard and Lee Cheryl
Home Financials for this Owner
Home Financials are based on the most recent Mortgage that was taken out on this home.
Original Mortgage
$94,400
Interest Rate
10.5%
Create a Home Valuation Report for This Property
The Home Valuation Report is an in-depth analysis detailing your home's value as well as a comparison with similar homes in the area
Home Values in the Area
Average Home Value in this Area
Purchase History
| Date | Buyer | Sale Price | Title Company |
|---|---|---|---|
| Strain Braxton | -- | Backman Title Services | |
| Jones Myron R | -- | Key Land Title | |
| Johnston Development Llc | -- | Gt Title Services | |
| Lee Richard | -- | Associated Title Company |
Source: Public Records
Mortgage History
| Date | Status | Borrower | Loan Amount |
|---|---|---|---|
| Open | Strain Braxton | $412,686 | |
| Previous Owner | Lee Richard | $94,400 |
Source: Public Records
Tax History
| Year | Tax Paid | Tax Assessment Tax Assessment Total Assessment is a certain percentage of the fair market value that is determined by local assessors to be the total taxable value of land and additions on the property. | Land | Improvement |
|---|---|---|---|---|
| 2025 | $1,688 | $186,450 | -- | -- |
| 2024 | $1,688 | $171,820 | $0 | $0 |
| 2023 | $1,696 | $173,085 | $0 | $0 |
| 2022 | $1,815 | $182,215 | $0 | $0 |
| 2021 | $1,549 | $249,400 | $87,100 | $162,300 |
| 2020 | $1,468 | $231,200 | $79,200 | $152,000 |
| 2019 | $1,328 | $214,400 | $71,000 | $143,400 |
| 2018 | $1,232 | $191,700 | $63,400 | $128,300 |
| 2017 | $1,086 | $90,915 | $0 | $0 |
| 2016 | $1,030 | $85,635 | $0 | $0 |
| 2015 | $918 | $75,845 | $0 | $0 |
| 2014 | $821 | $68,255 | $0 | $0 |
Source: Public Records
Map
Nearby Homes
- 420 N 150 W
- 823 N 400 W
- 383 W 625 N Unit A-D
- 361 W 625 N Unit A-D
- 451 N 500 W
- 451 N 500 W Unit 39
- 555 N 500 W Unit 24
- 118 E 100 N
- 433 E 450 N
- 443 E 450 N
- 1287 N 1390 E Unit 25-96
- 446 N 460 E Unit 9
- 128 S 300 W
- 323 W 100 S Unit 2
- 228 E Utah Ave
- 574 N 450 E
- 588 W Utah Ave
- 339 N 500 E Unit 3
- 327 N 500 E Unit 2
- 331 N 500 E Unit 2
Your Personal Tour Guide
Ask me questions while you tour the home.