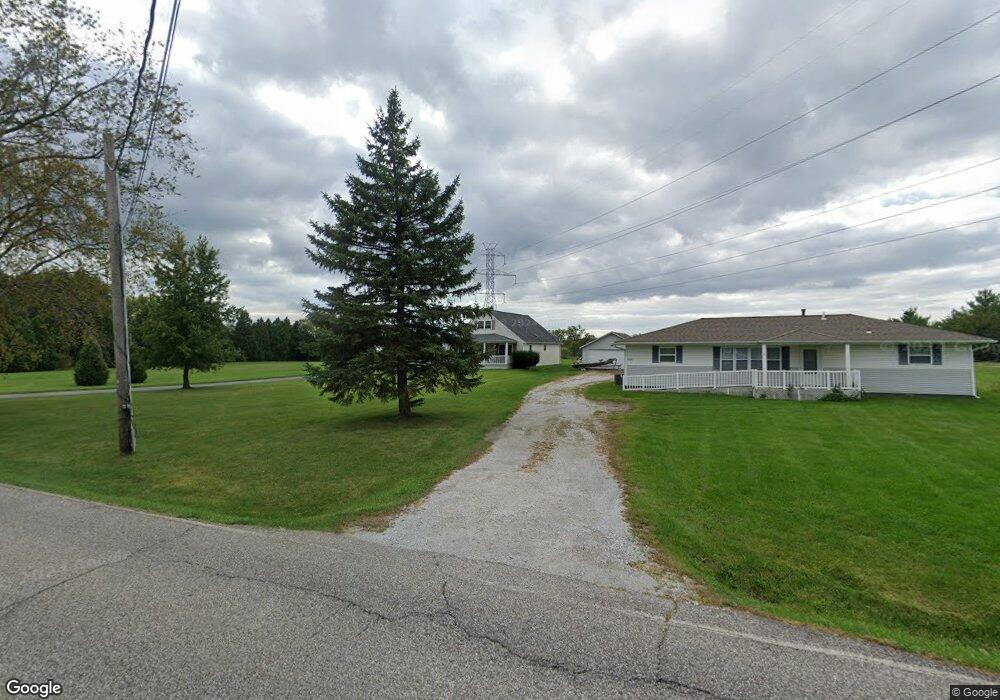
426 N 475 W Valparaiso, IN 46385
Porter County NeighborhoodEstimated Value: $299,000 - $338,000
3
Beds
2
Baths
1,865
Sq Ft
$169/Sq Ft
Est. Value
About This Home
This home is located at 426 N 475 W, Valparaiso, IN 46385 and is currently estimated at $315,852, approximately $169 per square foot. 426 N 475 W is a home located in Porter County with nearby schools including Union Township Middle School, Wheeler High School, and Emmanuel Baptist Academy.
Ownership History
Date
Name
Owned For
Owner Type
Purchase Details
Closed on
Apr 29, 2019
Sold by
Pavlinac Ronald J
Bought by
Pavlinac Ronald J
Current Estimated Value
Home Financials for this Owner
Home Financials are based on the most recent Mortgage that was taken out on this home.
Original Mortgage
$165,852
Outstanding Balance
$146,314
Interest Rate
4.37%
Mortgage Type
FHA
Estimated Equity
$169,538
Purchase Details
Closed on
Oct 29, 2007
Sold by
Pauley William L and Pauley Barbara F
Bought by
Pavlinac Ronald J
Home Financials for this Owner
Home Financials are based on the most recent Mortgage that was taken out on this home.
Original Mortgage
$183,000
Interest Rate
6.38%
Mortgage Type
Purchase Money Mortgage
Create a Home Valuation Report for This Property
The Home Valuation Report is an in-depth analysis detailing your home's value as well as a comparison with similar homes in the area
Home Values in the Area
Average Home Value in this Area
Purchase History
| Date | Buyer | Sale Price | Title Company |
|---|---|---|---|
| Pavlinac Ronald J | $185,000 | Indiana Title Network Company | |
| Pavlinac Ronald J | -- | Ticor Title Insurance |
Source: Public Records
Mortgage History
| Date | Status | Borrower | Loan Amount |
|---|---|---|---|
| Open | Pavlinac Ronald J | $165,852 | |
| Previous Owner | Pavlinac Ronald J | $183,000 |
Source: Public Records
Tax History Compared to Growth
Tax History
| Year | Tax Paid | Tax Assessment Tax Assessment Total Assessment is a certain percentage of the fair market value that is determined by local assessors to be the total taxable value of land and additions on the property. | Land | Improvement |
|---|---|---|---|---|
| 2024 | $1,485 | $221,700 | $37,400 | $184,300 |
| 2023 | $1,345 | $197,400 | $32,500 | $164,900 |
| 2022 | $1,258 | $182,500 | $32,500 | $150,000 |
| 2021 | $1,096 | $151,800 | $32,500 | $119,300 |
| 2020 | $1,030 | $141,500 | $28,500 | $113,000 |
| 2019 | $739 | $129,100 | $28,500 | $100,600 |
| 2018 | $753 | $124,400 | $28,500 | $95,900 |
| 2017 | $711 | $126,000 | $28,500 | $97,500 |
| 2016 | $693 | $124,000 | $29,100 | $94,900 |
| 2014 | $560 | $116,800 | $27,200 | $89,600 |
| 2013 | -- | $121,600 | $30,100 | $91,500 |
Source: Public Records
Map
Nearby Homes
- 424A Salt Creek Pkwy
- 421 Sandalwood Dr
- 384 Sandalwood Dr
- 364 Rainier Rd
- 372 Raven Ct
- 385 Riviera Ct
- 536 Riviera Rd
- 321 W 400 N
- 375 N 650 W
- 427 N State Road 149
- 286 State Route 130
- 397 W US Highway 30
- 536 W Us Highway 30
- 1950 St Road 130
- 279 Robbie Ln
- 631 Osage Rd
- 459 Surrey Hill Ln
- 628 Old Forge Rd
- 295 Holst Ln
- 305 Apple Grove Ln