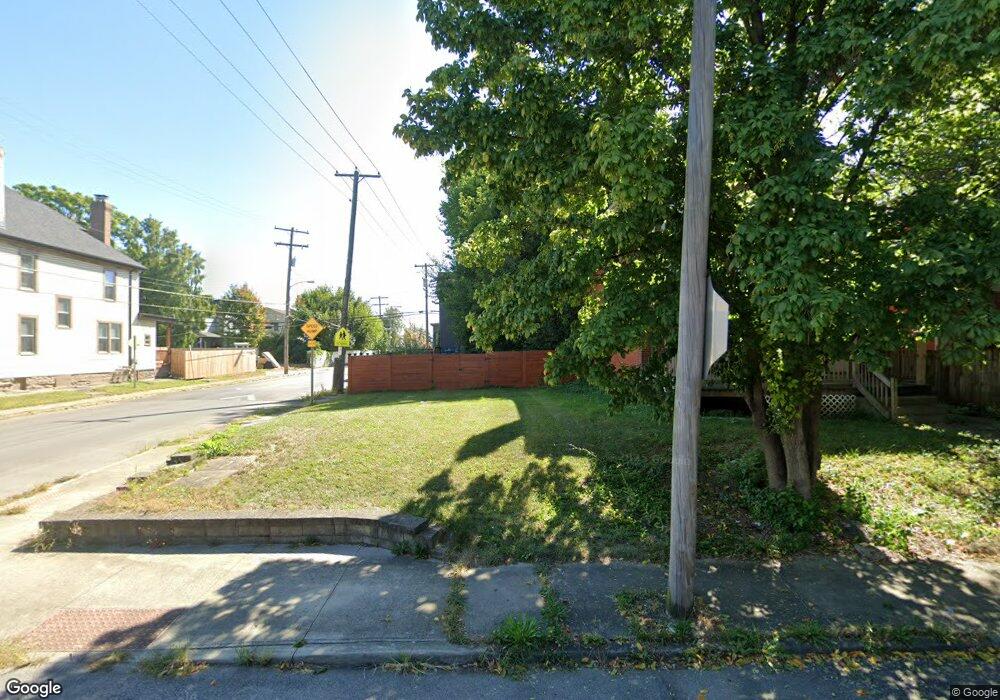
426 N Garfield Ave Columbus, OH 43203
King-Lincoln Bronzeville NeighborhoodEstimated Value: $32,000 - $369,000
6
Beds
2
Baths
4,284
Sq Ft
$39/Sq Ft
Est. Value
About This Home
This home is located at 426 N Garfield Ave, Columbus, OH 43203 and is currently estimated at $168,375, approximately $39 per square foot. 426 N Garfield Ave is a home located in Franklin County with nearby schools including Trevitt Elementary School, Champion Middle School, and East High School.
Ownership History
Date
Name
Owned For
Owner Type
Purchase Details
Closed on
Mar 26, 2021
Sold by
City Of Columbus
Bought by
Amr Kareem
Current Estimated Value
Purchase Details
Closed on
Mar 23, 2021
Sold by
City Of Columbus Ohio
Bought by
Amr Kareem
Purchase Details
Closed on
Mar 6, 2009
Sold by
Alm Homes Llc and Leonard Edward
Bought by
City Of Columbus
Purchase Details
Closed on
May 28, 1998
Sold by
Cope James A and Cope Susan J
Bought by
Alm Homes Llc
Purchase Details
Closed on
Oct 17, 1997
Sold by
Harvest Homes Of Ohio
Bought by
Cope James and Cope Susan J
Home Financials for this Owner
Home Financials are based on the most recent Mortgage that was taken out on this home.
Original Mortgage
$38,625
Interest Rate
7.65%
Mortgage Type
Balloon
Purchase Details
Closed on
Aug 20, 1997
Sold by
Robinson Thomas W and Robinson Thomas W
Bought by
Harvest Homes Of Ohio
Home Financials for this Owner
Home Financials are based on the most recent Mortgage that was taken out on this home.
Original Mortgage
$38,625
Interest Rate
7.65%
Mortgage Type
Balloon
Create a Home Valuation Report for This Property
The Home Valuation Report is an in-depth analysis detailing your home's value as well as a comparison with similar homes in the area
Home Values in the Area
Average Home Value in this Area
Purchase History
| Date | Buyer | Sale Price | Title Company |
|---|---|---|---|
| Amr Kareem | $7,920 | None Available | |
| Amr Kareem | $7,920 | Bennington Jeff | |
| City Of Columbus | $12,633 | Attorney | |
| Alm Homes Llc | -- | -- | |
| Cope James | $51,500 | -- | |
| Harvest Homes Of Ohio | $40,000 | Celtic Title Agency Inc |
Source: Public Records
Mortgage History
| Date | Status | Borrower | Loan Amount |
|---|---|---|---|
| Previous Owner | Cope James | $38,625 | |
| Previous Owner | Harvest Homes Of Ohio | $45,000 |
Source: Public Records
Tax History Compared to Growth
Tax History
| Year | Tax Paid | Tax Assessment Tax Assessment Total Assessment is a certain percentage of the fair market value that is determined by local assessors to be the total taxable value of land and additions on the property. | Land | Improvement |
|---|---|---|---|---|
| 2024 | $1,939 | $18,690 | $18,690 | -- |
| 2023 | $846 | $18,690 | $18,690 | $0 |
| 2022 | $132 | $2,490 | $2,490 | $0 |
| 2021 | $0 | $2,490 | $2,490 | $0 |
| 2020 | $0 | $2,490 | $2,490 | $0 |
| 2019 | $0 | $2,140 | $2,140 | $0 |
| 2018 | $0 | $2,140 | $2,140 | $0 |
| 2017 | $0 | $2,140 | $2,140 | $0 |
| 2016 | $0 | $2,170 | $2,170 | $0 |
| 2015 | -- | $2,170 | $2,170 | $0 |
| 2014 | -- | $2,170 | $2,170 | $0 |
| 2013 | -- | $2,170 | $2,170 | $0 |
Source: Public Records
Map
Nearby Homes
- 865 Old Leonard Ave
- 427 N Garfield Ave
- 423 Saint Clair Ave
- 456 Saint Clair Ave
- 529 Saint Clair Ave
- 0 N Monroe Ave
- 1290 Mount Vernon Ave
- 262 N 17th St
- 247 N 17th St Unit 247
- 241 N 17th St
- 376 N Garfield Ave Unit 78
- 191 Talmadge St
- 262 N 21st St
- 00 Atcheson St
- 1198 Atcheson St
- 0 Atcheson St Unit 224009260
- 166 Miami Ave
- 176 N 20th St
- 144 Miami Ave
- 542-544 Trevitt St
- 420 N Garfield Ave
- 416 N Garfield Ave Unit 418
- 416-418 N Garfield Ave
- 881 Atcheson St
- 412 N Garfield Ave
- 410 N Garfield Ave
- 436 N Garfield Ave Unit 436 & 438
- 436 N Garfield Ave Unit 2
- 887 Atcheson St
- 406 N Garfield Ave
- 440 N Garfield Ave Unit 442
- 890 Atcheson St
- 402 N Garfield Ave
- 417 N Monroe Ave Unit 419
- 411 N Monroe Ave
- 407 N Monroe Ave
- 444 N Garfield Ave Unit 446
- 423 N Garfield Ave
- 403 N Monroe Ave