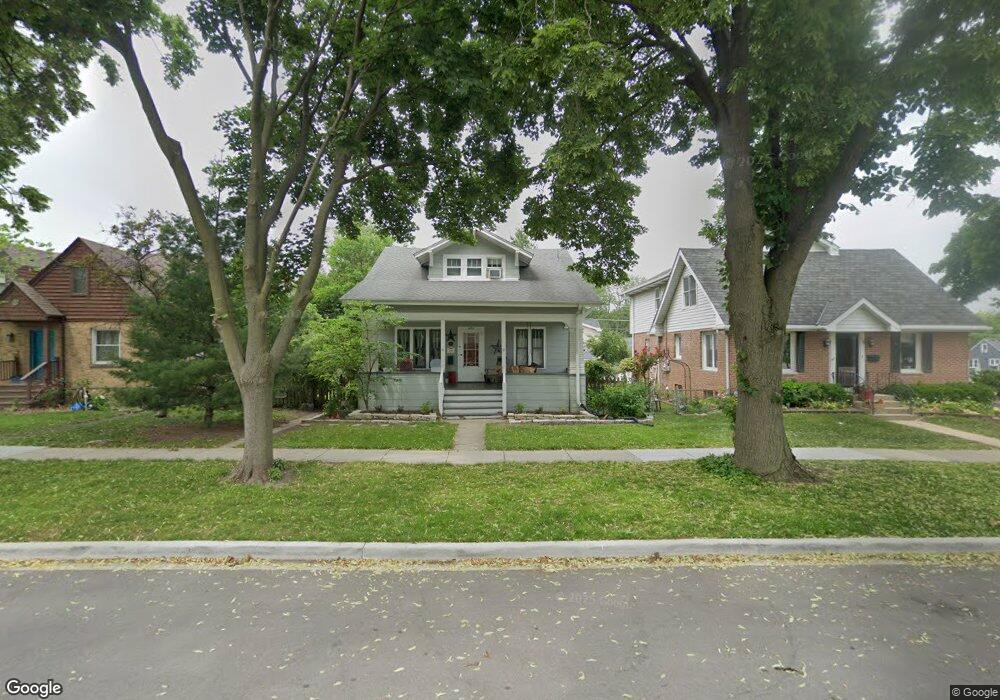
426 N Linden St Itasca, IL 60143
North Itasca NeighborhoodEstimated Value: $358,722 - $452,000
--
Bed
--
Bath
1,555
Sq Ft
$261/Sq Ft
Est. Value
About This Home
This home is located at 426 N Linden St, Itasca, IL 60143 and is currently estimated at $405,181, approximately $260 per square foot. 426 N Linden St is a home located in DuPage County with nearby schools including Raymond Benson Primary School, Elmer H Franzen Intermediate School, and Cornell Elementary School.
Ownership History
Date
Name
Owned For
Owner Type
Purchase Details
Closed on
Mar 12, 1999
Sold by
Tarbox Matthew F and Tarbox Mary Farrell
Bought by
Cahill Kevin D and Cahill Lisa A Bender
Current Estimated Value
Home Financials for this Owner
Home Financials are based on the most recent Mortgage that was taken out on this home.
Original Mortgage
$180,000
Outstanding Balance
$43,750
Interest Rate
6.8%
Estimated Equity
$361,431
Purchase Details
Closed on
Sep 29, 1995
Sold by
Miller Scott A and Miller Kristen D
Bought by
Tarbox Matthew F and Tarbox Mary Farrell
Home Financials for this Owner
Home Financials are based on the most recent Mortgage that was taken out on this home.
Original Mortgage
$136,000
Interest Rate
7.7%
Create a Home Valuation Report for This Property
The Home Valuation Report is an in-depth analysis detailing your home's value as well as a comparison with similar homes in the area
Home Values in the Area
Average Home Value in this Area
Purchase History
| Date | Buyer | Sale Price | Title Company |
|---|---|---|---|
| Cahill Kevin D | $200,000 | -- | |
| Tarbox Matthew F | $170,000 | -- |
Source: Public Records
Mortgage History
| Date | Status | Borrower | Loan Amount |
|---|---|---|---|
| Open | Cahill Kevin D | $180,000 | |
| Previous Owner | Tarbox Matthew F | $136,000 |
Source: Public Records
Tax History Compared to Growth
Tax History
| Year | Tax Paid | Tax Assessment Tax Assessment Total Assessment is a certain percentage of the fair market value that is determined by local assessors to be the total taxable value of land and additions on the property. | Land | Improvement |
|---|---|---|---|---|
| 2024 | $6,424 | $109,378 | $57,914 | $51,464 |
| 2023 | $6,095 | $100,550 | $53,240 | $47,310 |
| 2022 | $6,484 | $96,830 | $50,960 | $45,870 |
| 2021 | $6,161 | $92,750 | $48,810 | $43,940 |
| 2020 | $5,924 | $88,840 | $46,750 | $42,090 |
| 2019 | $5,781 | $85,420 | $44,950 | $40,470 |
| 2018 | $5,958 | $85,420 | $44,950 | $40,470 |
| 2017 | $5,598 | $81,640 | $42,960 | $38,680 |
| 2016 | $5,406 | $75,370 | $39,660 | $35,710 |
| 2015 | $5,234 | $69,630 | $36,640 | $32,990 |
| 2014 | $5,385 | $68,310 | $32,980 | $35,330 |
| 2013 | $5,264 | $69,700 | $33,650 | $36,050 |
Source: Public Records
Map
Nearby Homes
- 335 Arlington Rd
- 100 S Walnut St
- 711 E Greenview Rd
- 201 Walters Ln Unit 2A
- 791 Willow Ct
- 388 E Tall Oaks Ln Unit 302
- 1000 Surrey Ln
- 945 Willow St
- 324 Parkside Ave
- 206 E George St
- 525 S Cherry St
- 501 Bonnie Brae Ave
- 449 Broker Ave
- 445 Broker Ave
- 29 Bay Dr
- 261 Montgomery Ln Unit 18
- 507 Washington Square Unit 19
- 336 Dalewood Ave
- 213 Prospect Ave Unit 7
- 257 Bay St