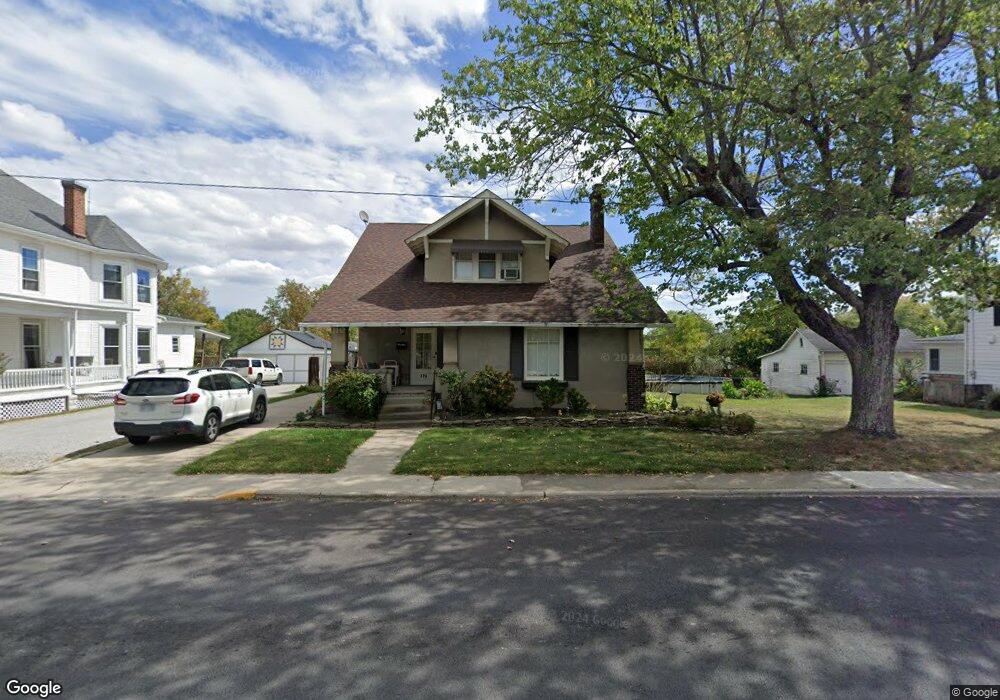
426 N Main St Georgetown, OH 45121
Estimated Value: $154,502 - $186,000
2
Beds
1
Bath
1,312
Sq Ft
$129/Sq Ft
Est. Value
About This Home
This home is located at 426 N Main St, Georgetown, OH 45121 and is currently estimated at $169,626, approximately $129 per square foot. 426 N Main St is a home located in Brown County with nearby schools including Georgetown Elementary School and Georgetown Jr/Sr High School.
Ownership History
Date
Name
Owned For
Owner Type
Purchase Details
Closed on
Nov 1, 2022
Sold by
Worley Joseph M and Worley Deborah S
Bought by
Worley Michael J
Current Estimated Value
Purchase Details
Closed on
Sep 22, 2006
Sold by
Green Roy A
Bought by
Worley Joseph M and Worley Deborah S
Home Financials for this Owner
Home Financials are based on the most recent Mortgage that was taken out on this home.
Original Mortgage
$54,000
Interest Rate
6.58%
Mortgage Type
Unknown
Purchase Details
Closed on
Dec 30, 2003
Sold by
Estate Of Prosser
Bought by
Prosser Juanita
Create a Home Valuation Report for This Property
The Home Valuation Report is an in-depth analysis detailing your home's value as well as a comparison with similar homes in the area
Home Values in the Area
Average Home Value in this Area
Purchase History
| Date | Buyer | Sale Price | Title Company |
|---|---|---|---|
| Worley Michael J | -- | -- | |
| Worley Joseph M | $44,000 | None Available | |
| Prosser Juanita | -- | -- |
Source: Public Records
Mortgage History
| Date | Status | Borrower | Loan Amount |
|---|---|---|---|
| Previous Owner | Worley Joseph M | $54,000 |
Source: Public Records
Tax History Compared to Growth
Tax History
| Year | Tax Paid | Tax Assessment Tax Assessment Total Assessment is a certain percentage of the fair market value that is determined by local assessors to be the total taxable value of land and additions on the property. | Land | Improvement |
|---|---|---|---|---|
| 2024 | $955 | $26,340 | $6,820 | $19,520 |
| 2023 | $955 | $18,740 | $5,760 | $12,980 |
| 2022 | $739 | $18,740 | $5,760 | $12,980 |
| 2021 | $732 | $18,740 | $5,760 | $12,980 |
| 2020 | $636 | $15,630 | $4,810 | $10,820 |
| 2019 | $631 | $15,630 | $4,810 | $10,820 |
| 2018 | $625 | $15,630 | $4,810 | $10,820 |
| 2017 | $495 | $14,690 | $5,290 | $9,400 |
| 2016 | $495 | $14,690 | $5,290 | $9,400 |
| 2015 | $505 | $14,690 | $5,290 | $9,400 |
| 2014 | $505 | $14,210 | $4,810 | $9,400 |
| 2013 | $504 | $14,210 | $4,810 | $9,400 |
Source: Public Records
Map
Nearby Homes
- 508 Mount Orab Pike
- 405 N Main St
- 403 Elmwood Ct
- 401 Elmwood Ct
- 406 E North St
- 60 New St
- 331 Spring Grove Dr
- 102 Bill Dee Dr
- 104 Elm St
- 427 Kenwood Ave
- 306 W 2nd St
- 402 S Pleasant St
- 874 Mount Orab Pike
- 505 S Water St
- 666 E State St
- 418 Home St
- 708 E State St
- 25 Douglas Ln
- 0 St Rt 221 & Footbridge Unit 1826509
- 155 Free Soil Rd