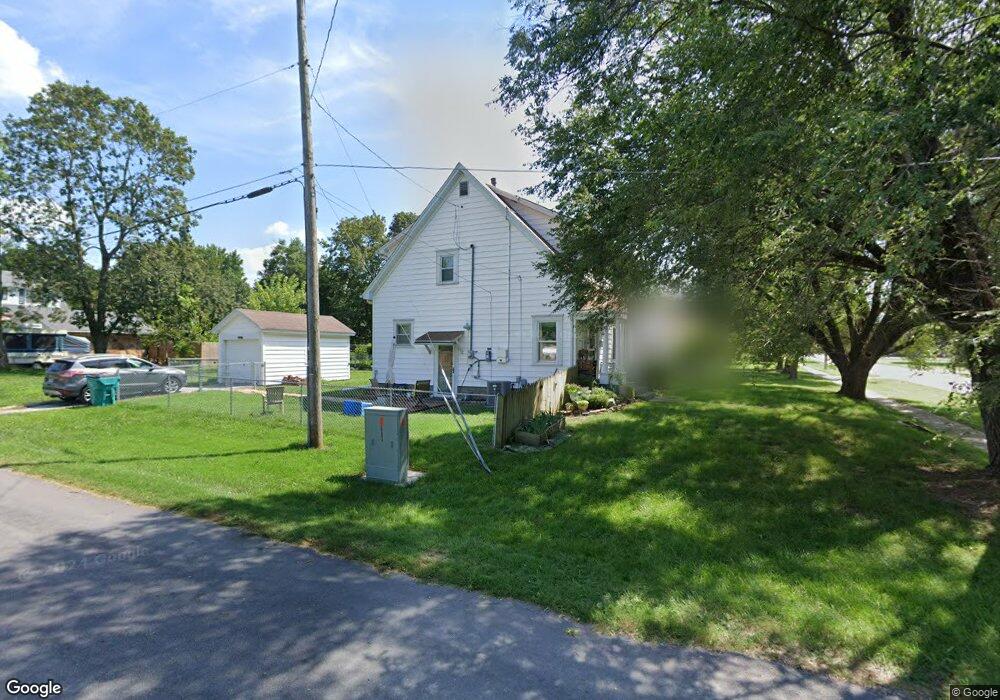
426 N Main St Republic, MO 65738
Estimated Value: $183,000 - $204,000
3
Beds
2
Baths
1,944
Sq Ft
$97/Sq Ft
Est. Value
About This Home
This home is located at 426 N Main St, Republic, MO 65738 and is currently estimated at $189,087, approximately $97 per square foot. 426 N Main St is a home located in Greene County with nearby schools including Schofield Elementary School, Republic Middle School, and Republic High School.
Ownership History
Date
Name
Owned For
Owner Type
Purchase Details
Closed on
Aug 31, 2016
Sold by
White Benny
Bought by
Boland Traci A
Current Estimated Value
Home Financials for this Owner
Home Financials are based on the most recent Mortgage that was taken out on this home.
Original Mortgage
$80,500
Outstanding Balance
$64,342
Interest Rate
3.45%
Mortgage Type
New Conventional
Estimated Equity
$124,745
Purchase Details
Closed on
Apr 7, 2014
Sold by
Hash John A and Hash Anna L
Bought by
White Benny
Purchase Details
Closed on
Jul 23, 2010
Sold by
Featheringill Ioda M and Featheringill Jack R
Bought by
Hash John A and Hash Anna L
Home Financials for this Owner
Home Financials are based on the most recent Mortgage that was taken out on this home.
Original Mortgage
$95,414
Interest Rate
4.75%
Mortgage Type
FHA
Create a Home Valuation Report for This Property
The Home Valuation Report is an in-depth analysis detailing your home's value as well as a comparison with similar homes in the area
Home Values in the Area
Average Home Value in this Area
Purchase History
| Date | Buyer | Sale Price | Title Company |
|---|---|---|---|
| Boland Traci A | -- | None Available | |
| White Benny | -- | None Available | |
| Hash John A | -- | Lincoln Land Title Inc |
Source: Public Records
Mortgage History
| Date | Status | Borrower | Loan Amount |
|---|---|---|---|
| Open | Boland Traci A | $80,500 | |
| Previous Owner | Hash John A | $95,414 |
Source: Public Records
Tax History
| Year | Tax Paid | Tax Assessment Tax Assessment Total Assessment is a certain percentage of the fair market value that is determined by local assessors to be the total taxable value of land and additions on the property. | Land | Improvement |
|---|---|---|---|---|
| 2025 | $986 | $18,560 | $5,700 | $12,860 |
| 2024 | $916 | $16,400 | $4,750 | $11,650 |
| 2023 | $899 | $16,400 | $4,750 | $11,650 |
| 2022 | $924 | $16,780 | $4,750 | $12,030 |
| 2021 | $918 | $16,780 | $4,750 | $12,030 |
| 2020 | $933 | $16,780 | $4,750 | $12,030 |
| 2019 | $930 | $16,780 | $4,750 | $12,030 |
| 2018 | $889 | $15,500 | $3,800 | $11,700 |
| 2017 | $881 | $14,590 | $3,800 | $10,790 |
| 2016 | $839 | $14,590 | $3,800 | $10,790 |
| 2015 | $836 | $14,590 | $3,800 | $10,790 |
| 2014 | $841 | $14,550 | $3,800 | $10,750 |
Source: Public Records
Map
Nearby Homes
- 217 W Logan St
- 411 N College Ave
- 1213 N London Place
- 319 W Hines St
- 626 N Phelps Ave
- 605 N West Ave
- 347 W Elm St
- 425 E Harrison St
- 413 W Elm St
- 421 W Elm St
- 114 S Eagan St
- 514 E Kay St
- 923 N Travis Ave
- 393 N Ladera Dr
- 401 S West Ave
- 00 N Boston Ln
- 630 E Kay St
- 548 S Buxton Ln
- 511 S Main Ave
- 0 Highway 60 Unit 60308100
- 426 N Main Ave
- 418 N Main Ave
- 504 N Main Ave
- 425 N Pine Ave
- 408 N Main Ave
- 419 N Pine Ave
- 408 N Main St
- 415 N Main Ave
- 421 N Main Ave
- 514 N Main Ave
- 404 N Main Ave
- 505 N Pine Ave
- 409 N Main Ave
- 418 N Walnut Ave
- 418 N Walnut Ave
- 513 N Pine Ave
- 403 N Main Ave
- 520 N Main Ave
- 403 N Main St
- 422 N Pine Ave
Your Personal Tour Guide
Ask me questions while you tour the home.