Estimated Value: $338,623 - $481,000
2
Beds
2
Baths
1,256
Sq Ft
$320/Sq Ft
Est. Value
About This Home
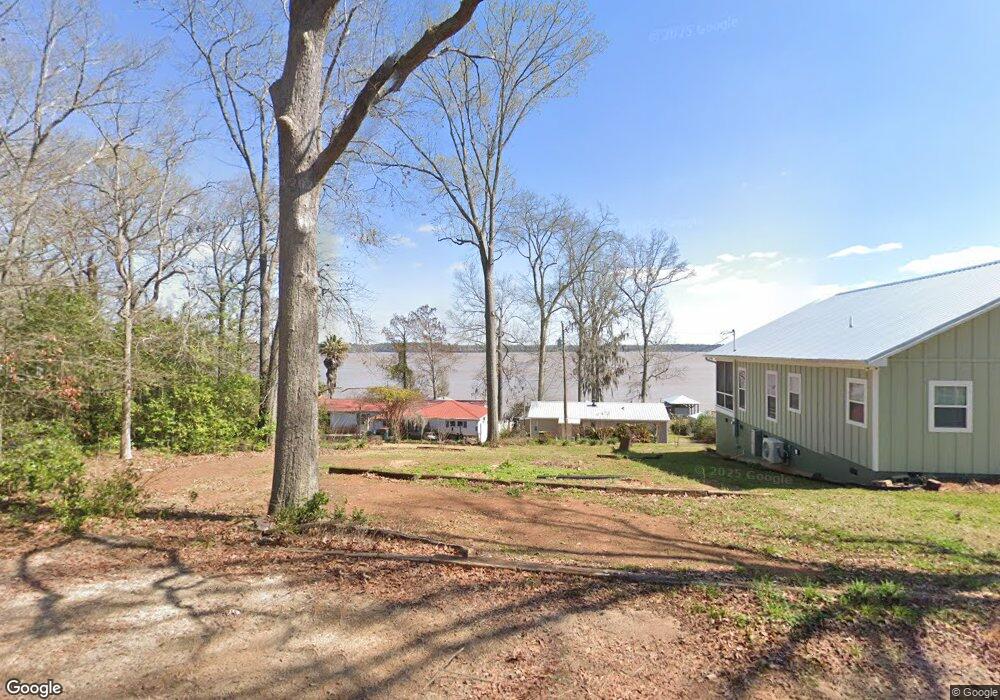
This home is located at 426 N Spring Creek Cir, Cobb, GA 31735 and is currently estimated at $402,406, approximately $320 per square foot. 426 N Spring Creek Cir is a home located in Sumter County with nearby schools including Sumter County Primary School, Sumter County Elementary School, and Sumter County Middle School.
Ownership History
Date
Name
Owned For
Owner Type
Purchase Details
Closed on
Mar 27, 2019
Sold by
Oakatee Holdings Llc
Bought by
Smith Adam W and Smith Nancy C
Current Estimated Value
Home Financials for this Owner
Home Financials are based on the most recent Mortgage that was taken out on this home.
Original Mortgage
$122,087
Outstanding Balance
$93,612
Interest Rate
4.3%
Mortgage Type
New Conventional
Estimated Equity
$308,794
Purchase Details
Closed on
Jun 22, 2017
Sold by
Not Provided
Bought by
Oakatee Holdings Llc
Purchase Details
Closed on
Apr 4, 2017
Sold by
Betty R
Bought by
Branch Banking & Trust Co
Purchase Details
Closed on
Mar 9, 2001
Sold by
Smith Bobby Edward
Bought by
Mills David T
Purchase Details
Closed on
Nov 25, 1997
Sold by
Smith Bernice I
Bought by
Smith Bobby Edward
Purchase Details
Closed on
Jul 1, 1962
Bought by
Smith Henry Clinton
Create a Home Valuation Report for This Property
The Home Valuation Report is an in-depth analysis detailing your home's value as well as a comparison with similar homes in the area
Home Values in the Area
Average Home Value in this Area
Purchase History
| Date | Buyer | Sale Price | Title Company |
|---|---|---|---|
| Smith Adam W | $170,000 | -- | |
| Oakatee Holdings Llc | $78,225 | -- | |
| Branch Banking & Trust Co | -- | -- | |
| Federal Home Loan Mortgage Corporation | $47,554 | -- | |
| Mills David T | $60,000 | -- | |
| Smith Bobby Edward | -- | -- | |
| Smith Bernice I | -- | -- | |
| Smith Henry Clinton | -- | -- |
Source: Public Records
Mortgage History
| Date | Status | Borrower | Loan Amount |
|---|---|---|---|
| Open | Smith Adam W | $122,087 |
Source: Public Records
Tax History Compared to Growth
Tax History
| Year | Tax Paid | Tax Assessment Tax Assessment Total Assessment is a certain percentage of the fair market value that is determined by local assessors to be the total taxable value of land and additions on the property. | Land | Improvement |
|---|---|---|---|---|
| 2024 | $3,083 | $85,880 | $26,720 | $59,160 |
| 2023 | $1,845 | $47,680 | $26,720 | $20,960 |
| 2022 | $1,924 | $48,280 | $26,720 | $21,560 |
| 2021 | $1,853 | $45,828 | $26,720 | $19,108 |
| 2020 | $1,057 | $18,900 | $1,480 | $17,420 |
| 2019 | $984 | $18,900 | $1,480 | $17,420 |
| 2018 | $784 | $18,900 | $1,480 | $17,420 |
| 2017 | $749 | $18,900 | $1,480 | $17,420 |
| 2016 | $750 | $18,900 | $1,480 | $17,420 |
| 2015 | $812 | $21,100 | $3,000 | $18,100 |
| 2014 | $811 | $21,100 | $3,000 | $18,100 |
| 2013 | -- | $21,100 | $3,000 | $18,100 |
Source: Public Records
Map
Nearby Homes
- TBD N Spring Creek Cir
- 0 N Spring Creek Cir
- 252 N Spring Creek Cir
- 108 N Spring Creek Cir
- 115 Cypress Ln
- 113 Cypress Ln
- 114 Water Front Rd
- TBD Sawdust Trail
- 170D Cantey Dr
- 152 Cantey Dr
- 101 Rose Ln
- 151 Gary Brewer Rd
- 0 Statham Lake Front
- 244 Cannon Branch Rd
- 100 Valhalla
- 154 Cannon Branch Rd
- 106 Flintview Dr
- Lot # 18 Cannon Branch Rd
- Lot #35 Cannon Branch Rd
- Lot #32 Cannon Branch Rd
- 418 N Spring Creek Cir
- 137 Bailey Ln
- 441 N Spring Creek Cir
- 185 Lakeview Dr
- 126 Bailey Ln
- 447 N Spring Creek Cir
- 410 N Spring Creek Cir
- 125 Bailey Ln
- 406 N Spring Creek Cir
- 409 N Spring Creek Cir
- 123 Bailey Ln
- 451 N Spring Creek Cir
- 402 N Spring Creek Cir
- 405 N Spring Creek Cir
- 405 N Spring Creek Cir
- 113 Bailey Ln
- 400 N Spring Creek Cir
- 392 N Spring Creek Cir
- 109 Bailey Ln
- 391-A N Spring Creek Cir